One of our main interests is the design and synthesis of anti-viral agents that inhibit the function of certain viral ion channel proteins and the exploration of their structure-activity relationships. Α current target is the influenza A virus. Τhe prototype compounds in this series, amantadine (Amt) (1)and (Rim) rimantadine (2) were commercial A drugs. Their protonated form blocks the influenza A WT M2 membrane protein proton channel activity which is necessary for virus replication and budding. The M2 pore is the transmembrane domain of the tetrameric M2 protein ie, the 25 residue M2TM peptide tetramer.
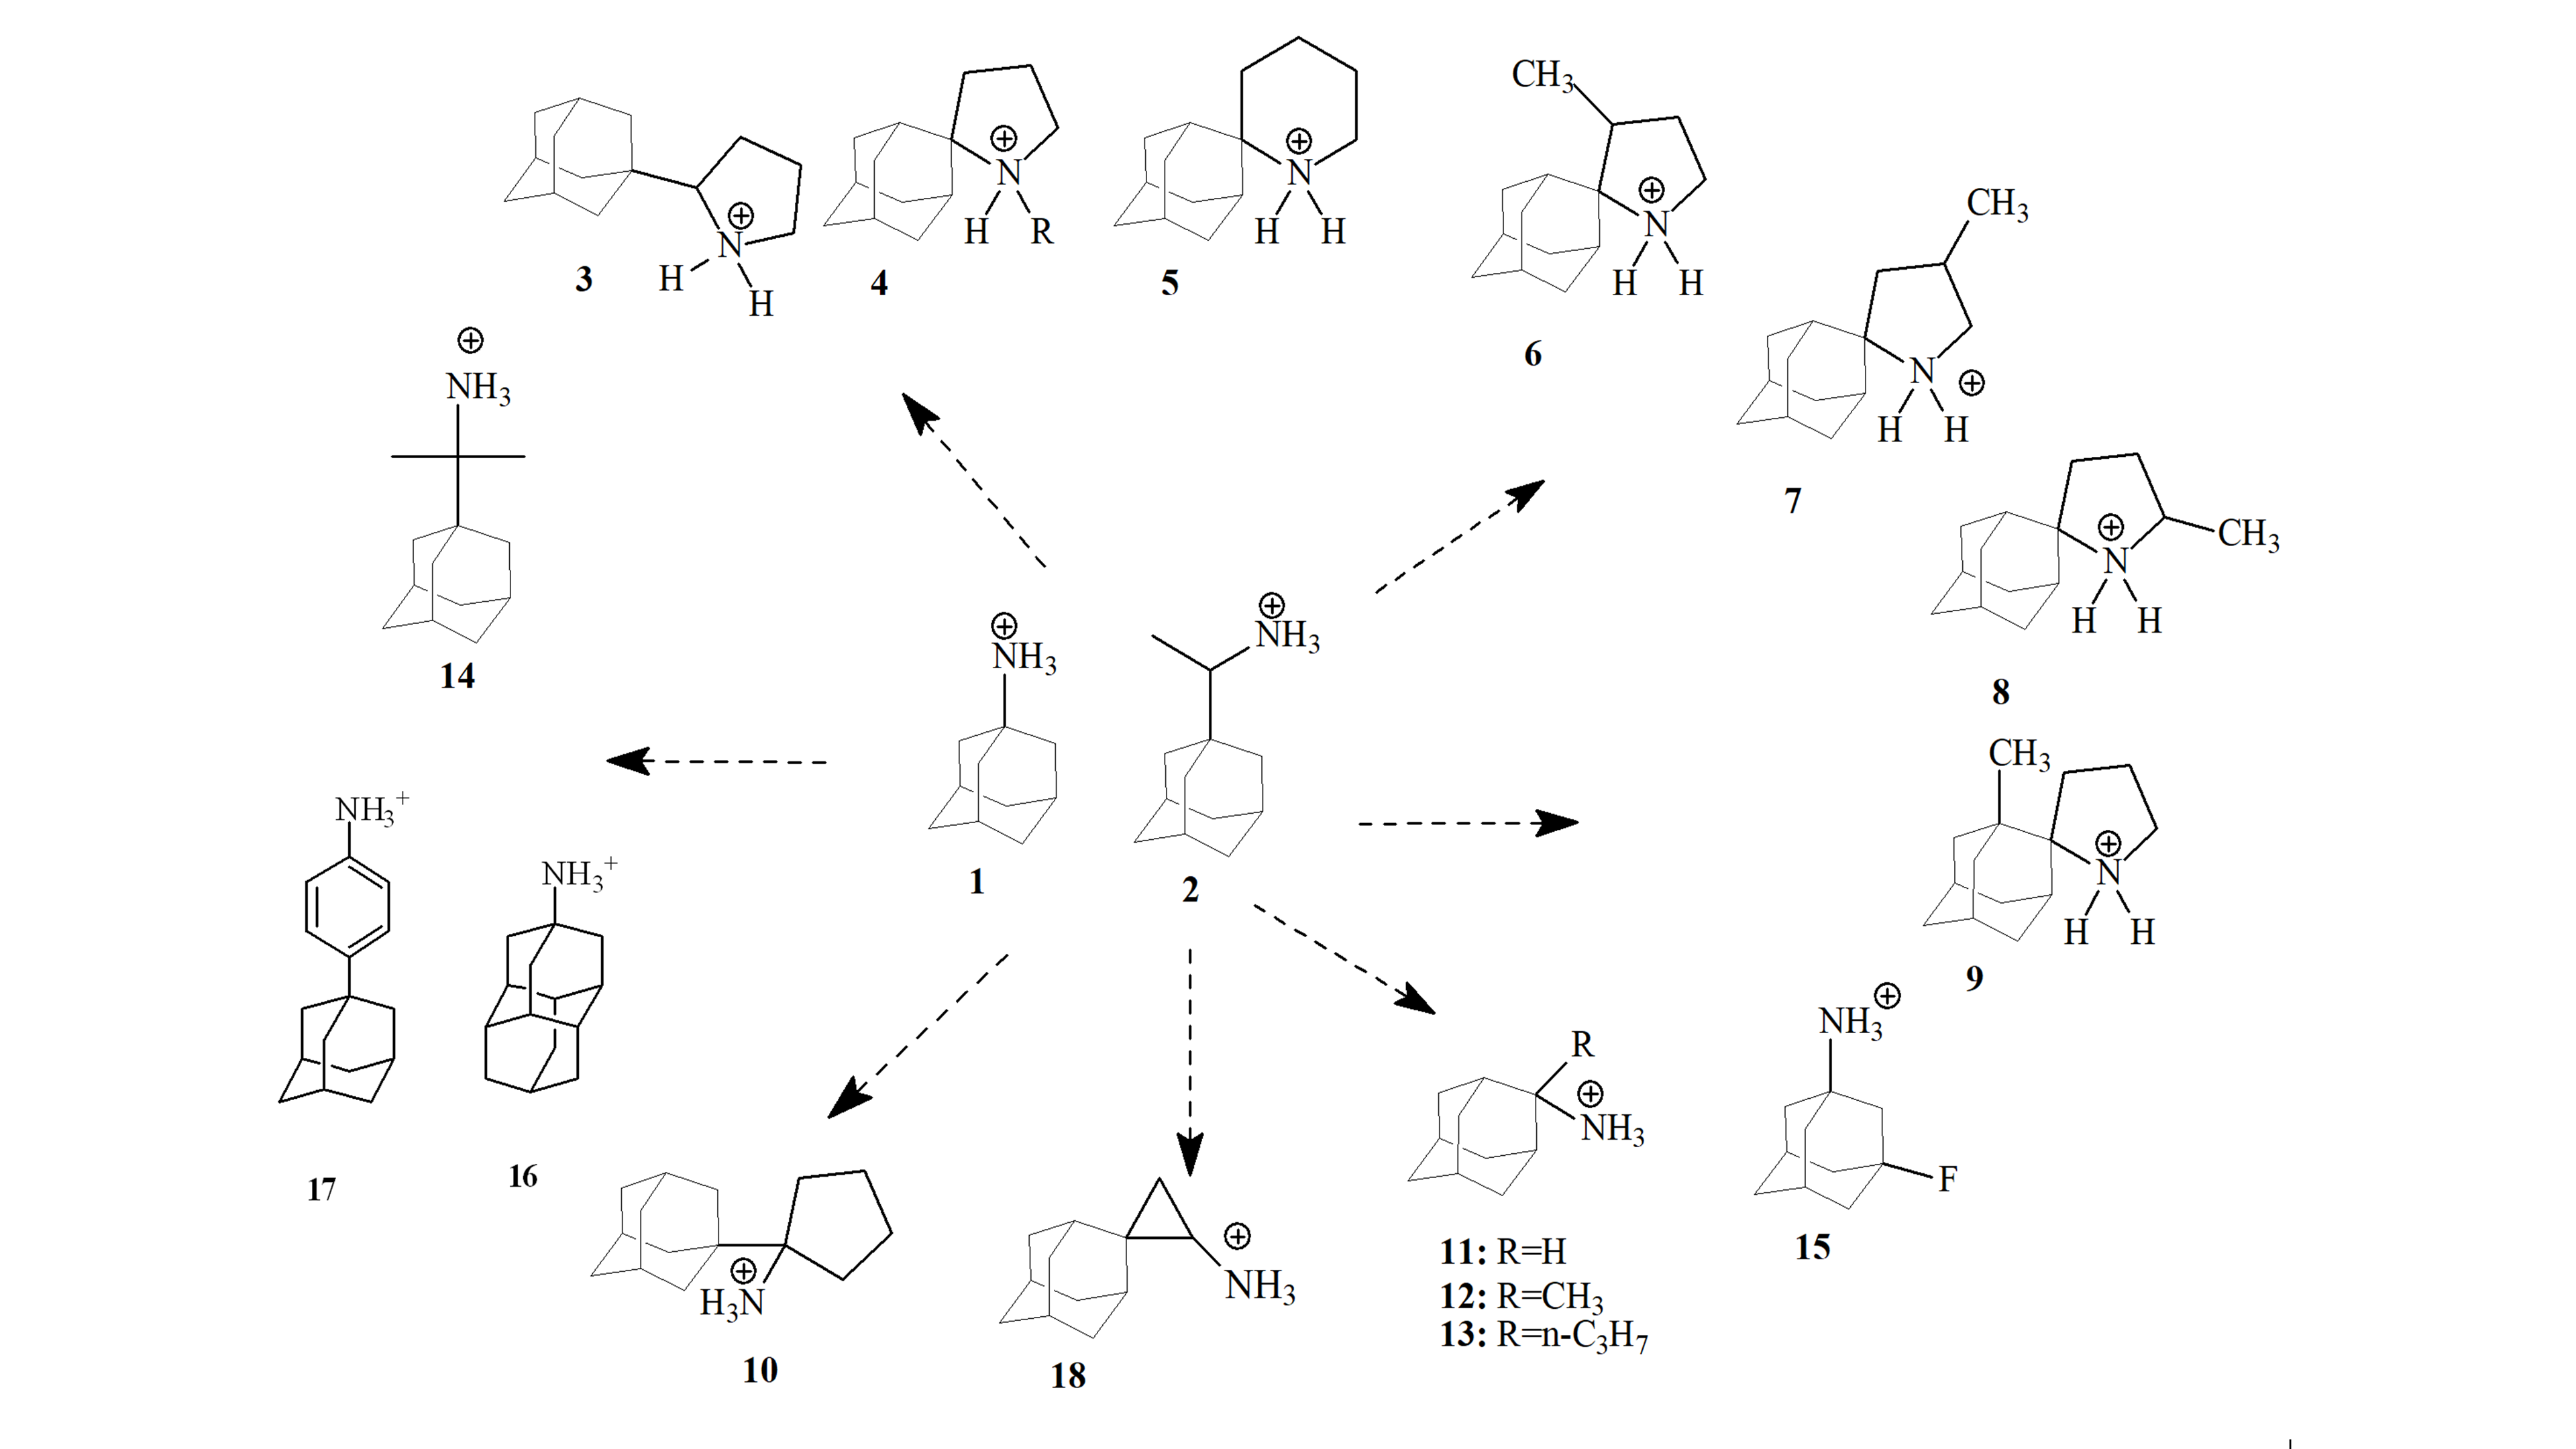
♦ Since 2005, 1/2-resistant mutants have become prevalent globally, with S31N being the dominant, abrogating clinical usefulness of 1 and 2. We have synthesized Amt analogues with sizeable adducts active against V27A (compound 16) and/or L26F M2 (compounds 14 16 etc) mutant proteins (Scheme 1).
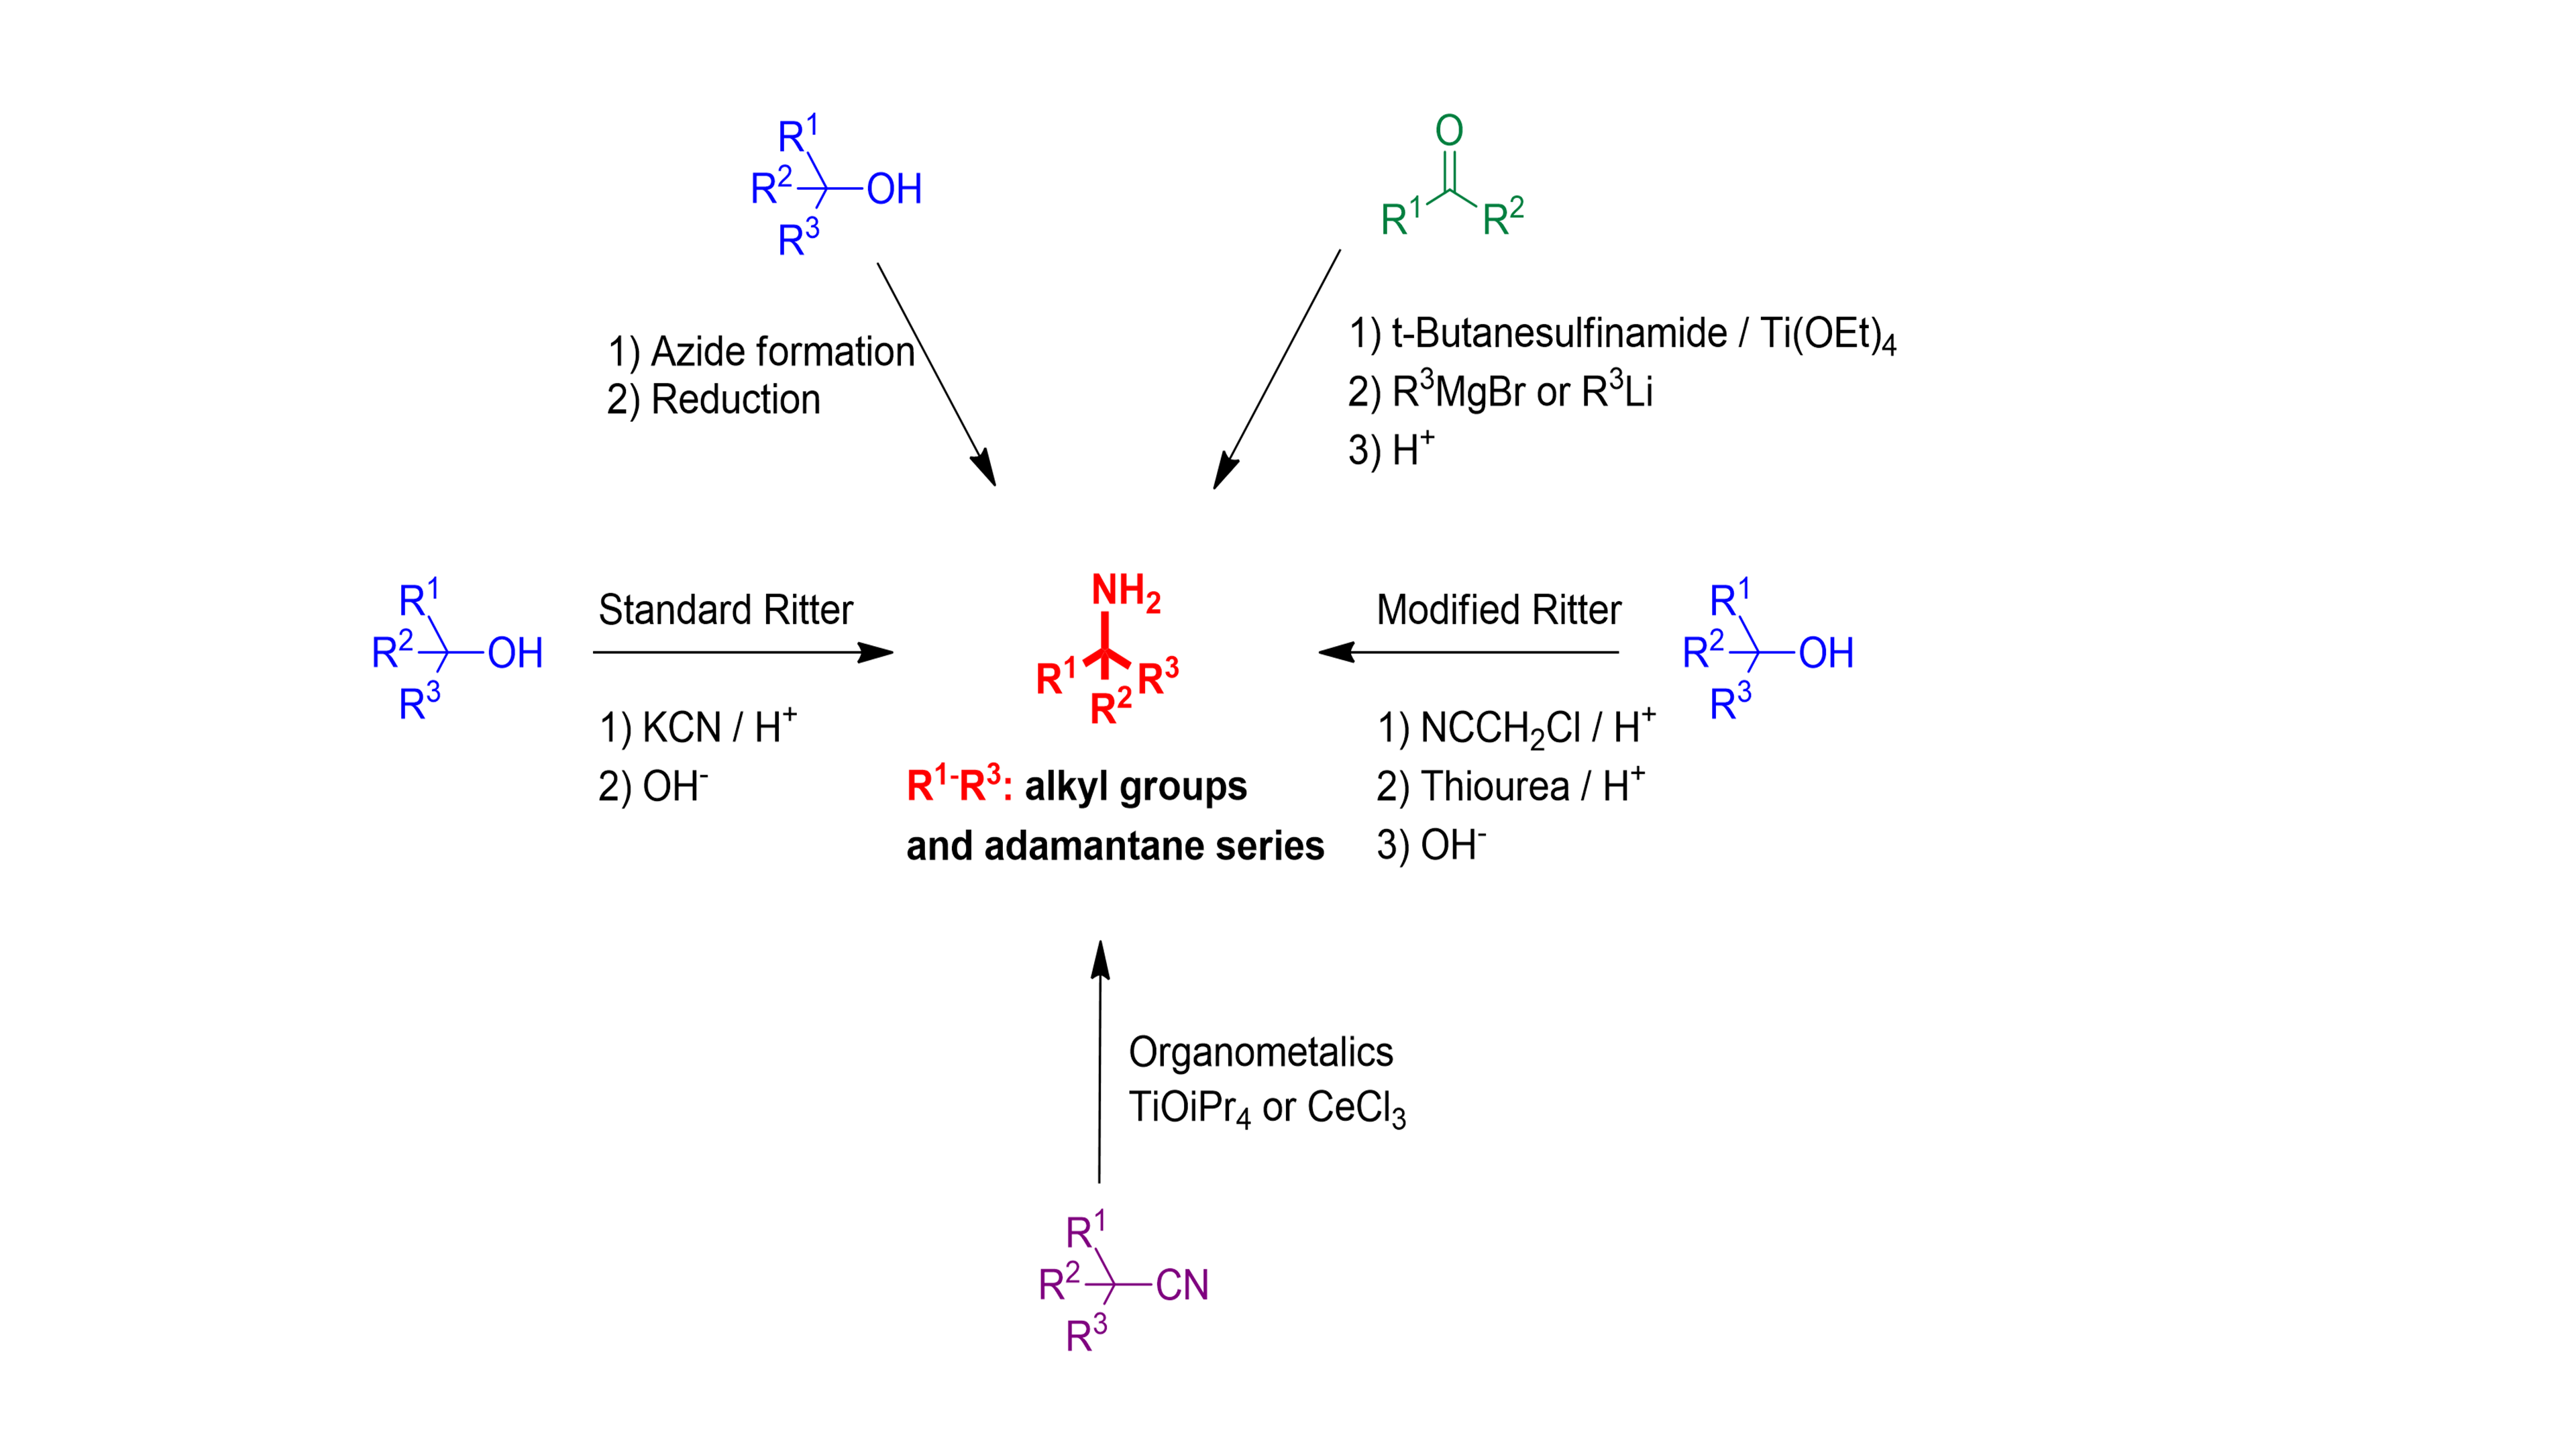
♦ We have been involved in investigation of the best practical routes for preparation of tert-alkyl amines (Scheme 2)
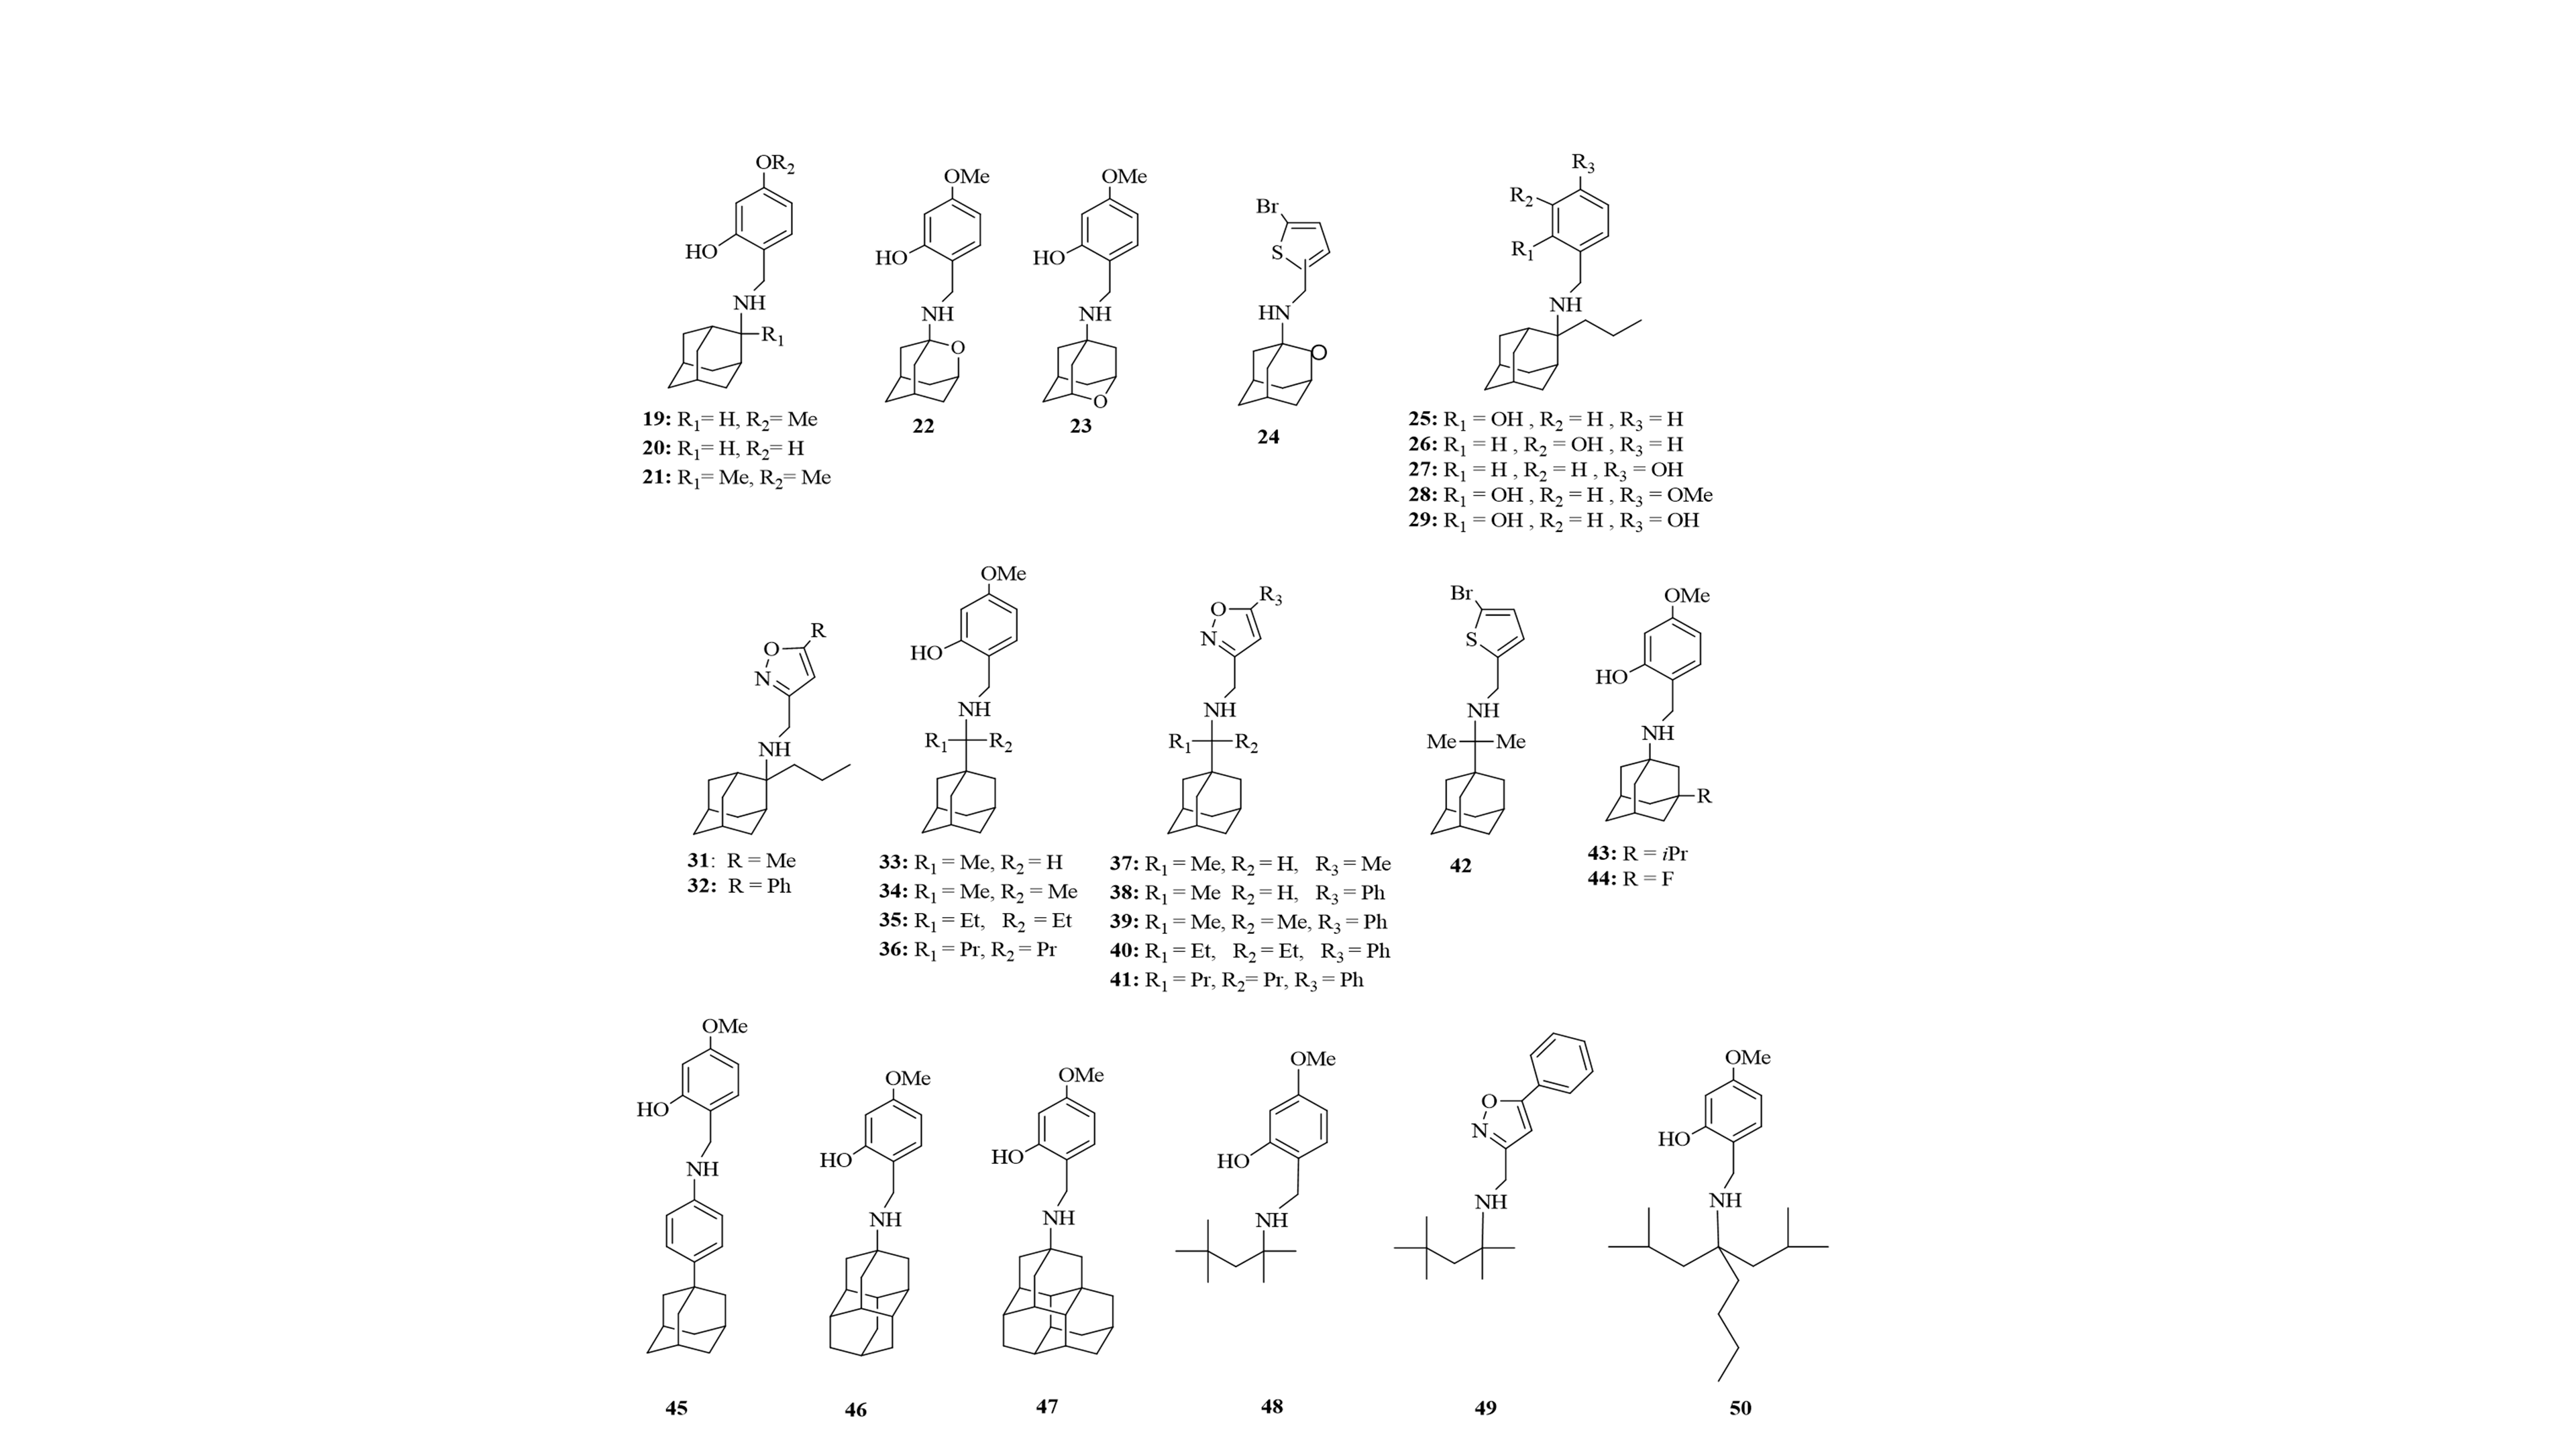
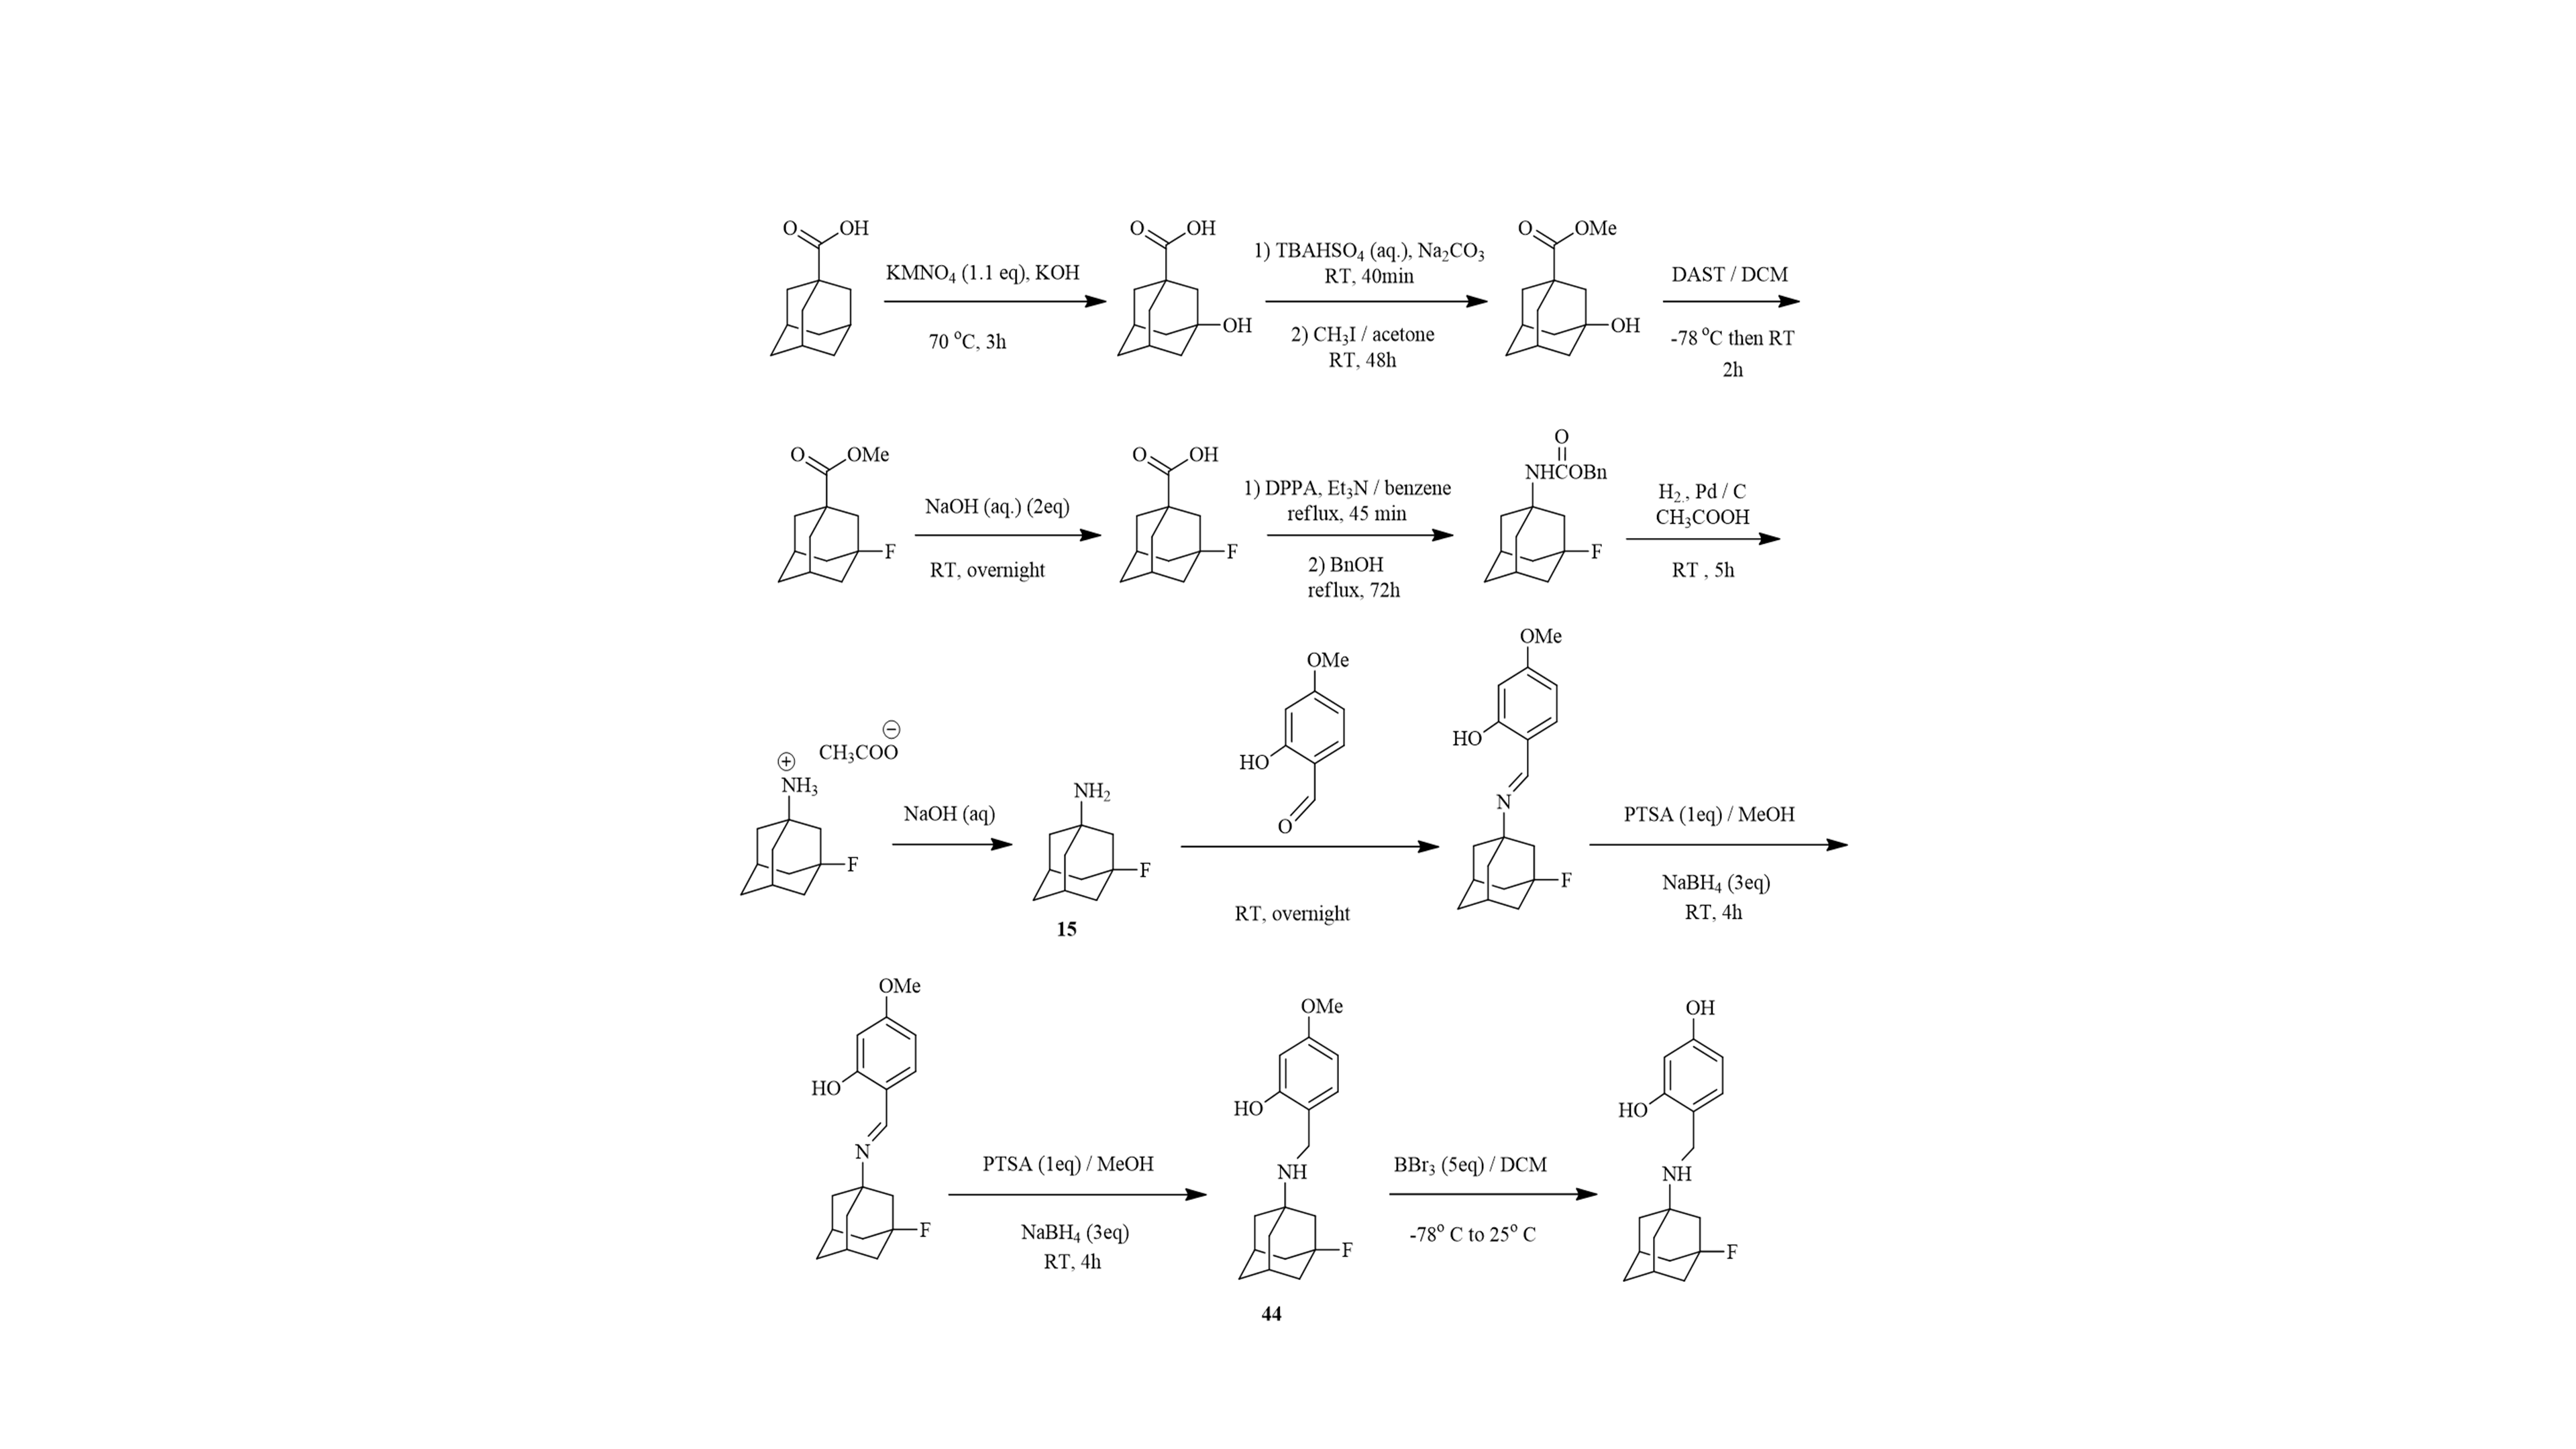
♦ We have synthesized new conjugates of Amt with polar heads which are multi-strain inhibitors of S31N, V27A, L26F, A30T, G34E, viruses (Scheme 3, Scheme 4).
♦ Divalent copper inhibited M2 WT proton current through complexation of H37 residues. We have prepared copper complexes of Amt in an effort to prepare compounds which can inhibited all strains of influenza A M2 which are resistant to amantadine (in collaboration with Professor S. Hadjikakou, Ioannina).
♦ Whole cell antiviral testing assays and generation of the mutant viruses are applied for testing biological activity and mutagenesis studies are applied for investigation of the escaping mechanisms of the virus (in collaboration with Prof. M. Schmidtke and Prof. R. Zell, Jena).
♦ Electrophysiogy (EP) experiments for testing the M2 channels blocking (with Prof. D. Busath, Utah and Assist. Prof. Jun Wang, Arizona).
♦ MD simulations are used in my lab for investigation of SAR studies (Figure 1). Steered MD simulations is a method that allowed quick calculation of the relative force for drugs to enter and escape channel. This helps to account for the activity of the compounds, their kinetics, and thus to improve potency.
♦ The expression and purification of the full M2 protein is realized in an effort to develop indirect methods for measuring binding affinities against the full M2. The assay involves the inhibition of quenching of Trp41 fluorescence at acidic pH induced by the Aamt ligand binding (in collaboration with Dr D. Mastellos, Dimokritos Institute, Athens).
Scheme 3. Discovery of resistance-breaking inhibitors targeting the M2 proton channel of influenza A viruses.
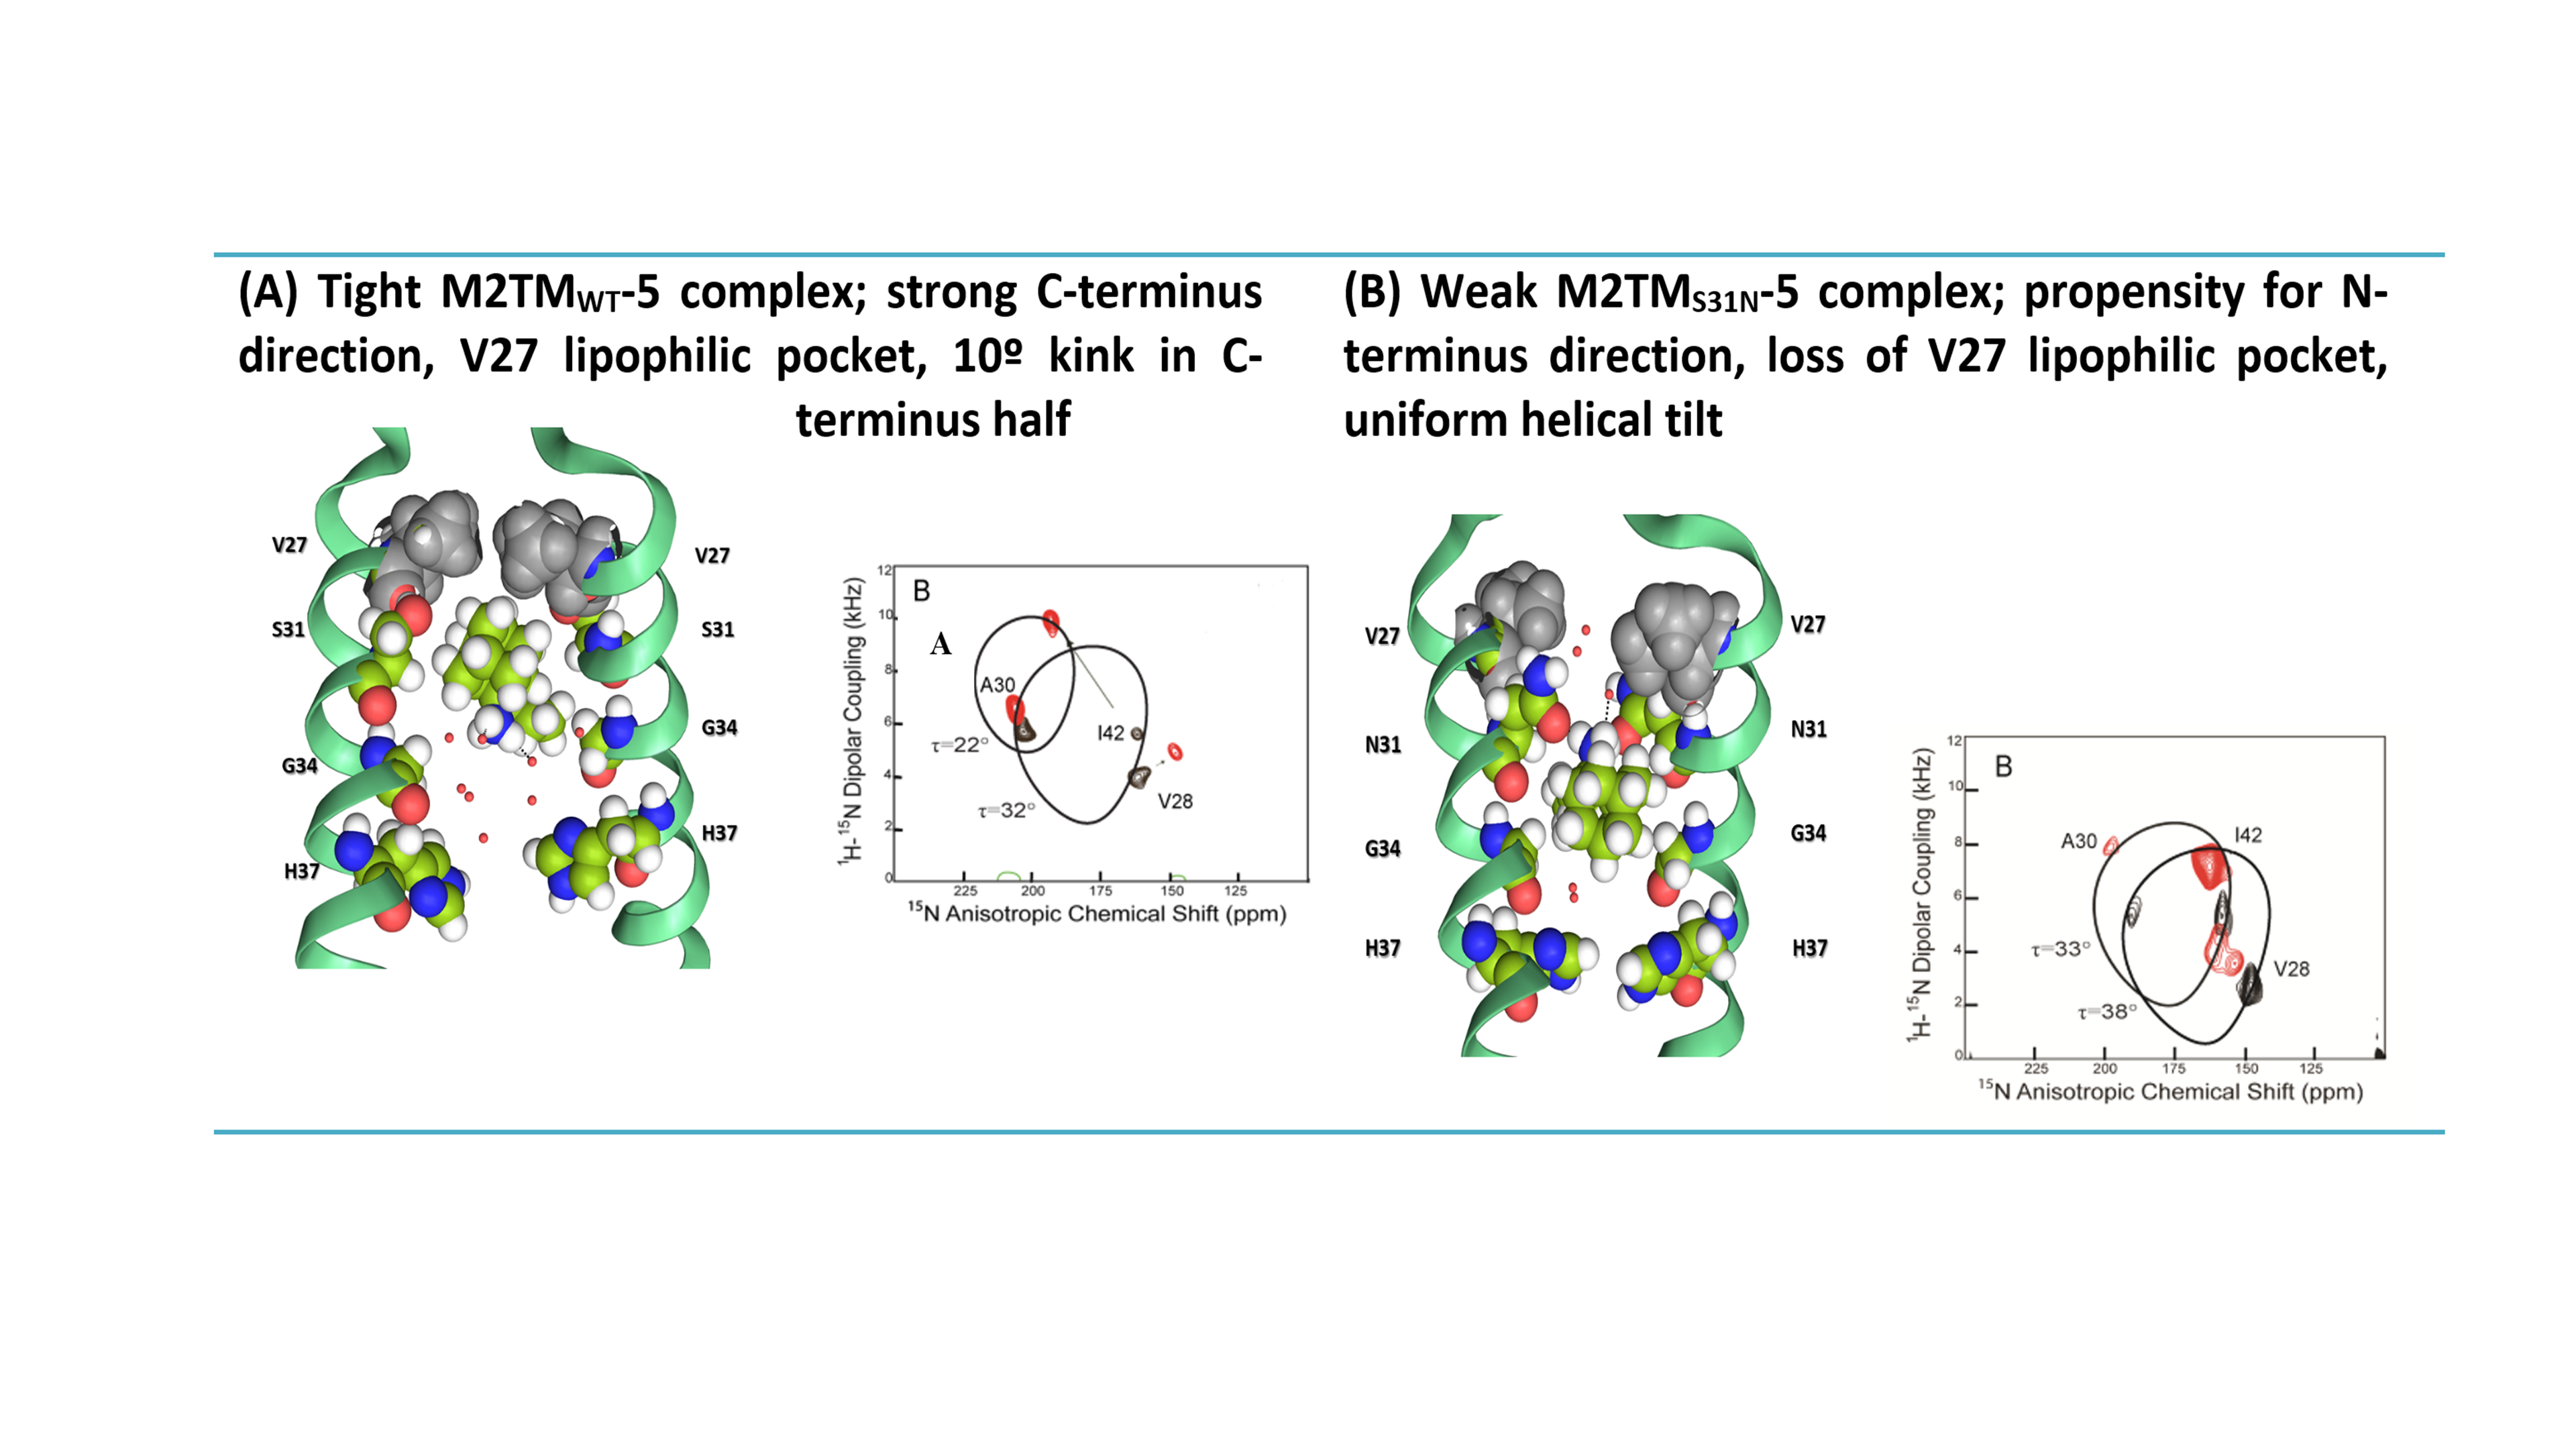
Figure 1. Representative replica from the simulation of compound 45 bound to (A) M2TMWT and (B) M2TMS31N hydrated DMPCafter 100 ns of production. Waters passage in (B) is consistent with inability of this compound to block M2 S31N.
A second research area, which is complementary to the first, is aiming at understanding and following the interactions between Amt analogues and influenza M2 protein receptor, M2TM (22-46) or M2TM with the amphipathic helices of M2 C-end, i.e. M2AH (21-62) (known as full M2 since the N-end from 1-22 is unstructured) using biophysical methods.
♦ ITC measurements of the binding constants of Amt ligands against M2TM (in collaboration with Prof. G. Gauglitz, Tubingen).
♦ Measurements of binding constants between Amt analogues and the full length M2 protein using the inhibition of quenching of Trp41 fluorescence at acidic pH induced by the Aamt ligand (in collaboration with Prof. Alan Hay, London).
♦ The performance of FEP/MD using Desmond and OPLS2005, and TI/MD simulations using Amber14 and ff14sb (Scheme 6) using binding constants as experimental probes (in collaboration with Prof. G. Gauglitz, Tubingen) which were performed in my lab in order to develop binding free energies protocols for accurate calculations of subtle changes in ligands structure (Figures 2,3).
♦ The performance of binding free energy MM-PBSA calculations for the interpretation of the thermodynamic profiles for Aamt compounds binding to M2TM using ITC and the usage of this information for successfully and prospectively prioritizing Aamt derivatives.
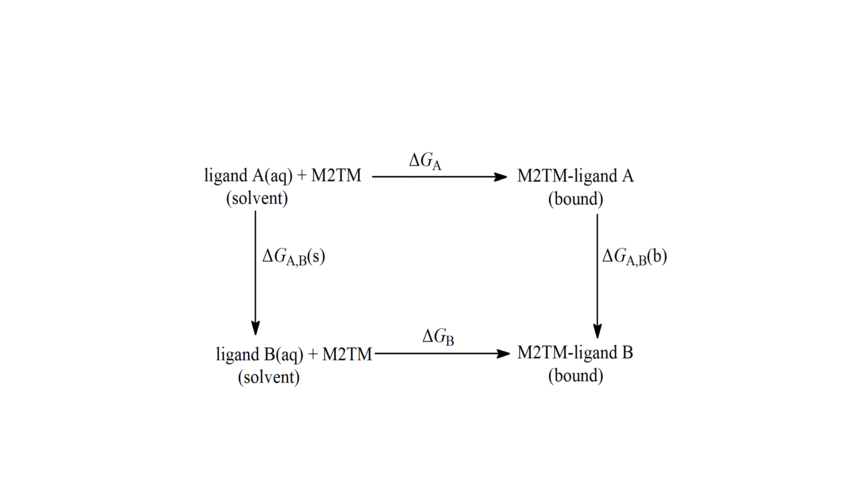
Scheme 5. Thermodynamic cycle for the calculation of relative free energies of binding applied to alchemical tranformations of Aamt derivatives. ΔGA, ΔGB are the free energies of transfer of A and B from the aqueous phase (unbound state) to the bound state, respectively. ΔGA,B(s) and ΔGA,B(b) are the free energy differences of the mutation of A into B in aqueous solution, and bound to the protein respectively calculated using the BAR method. The calculations were based on the thermodynamic cycle using equation: ΔΔGligand A→ B = ΔGA,B(b) - ΔGA,B(s).
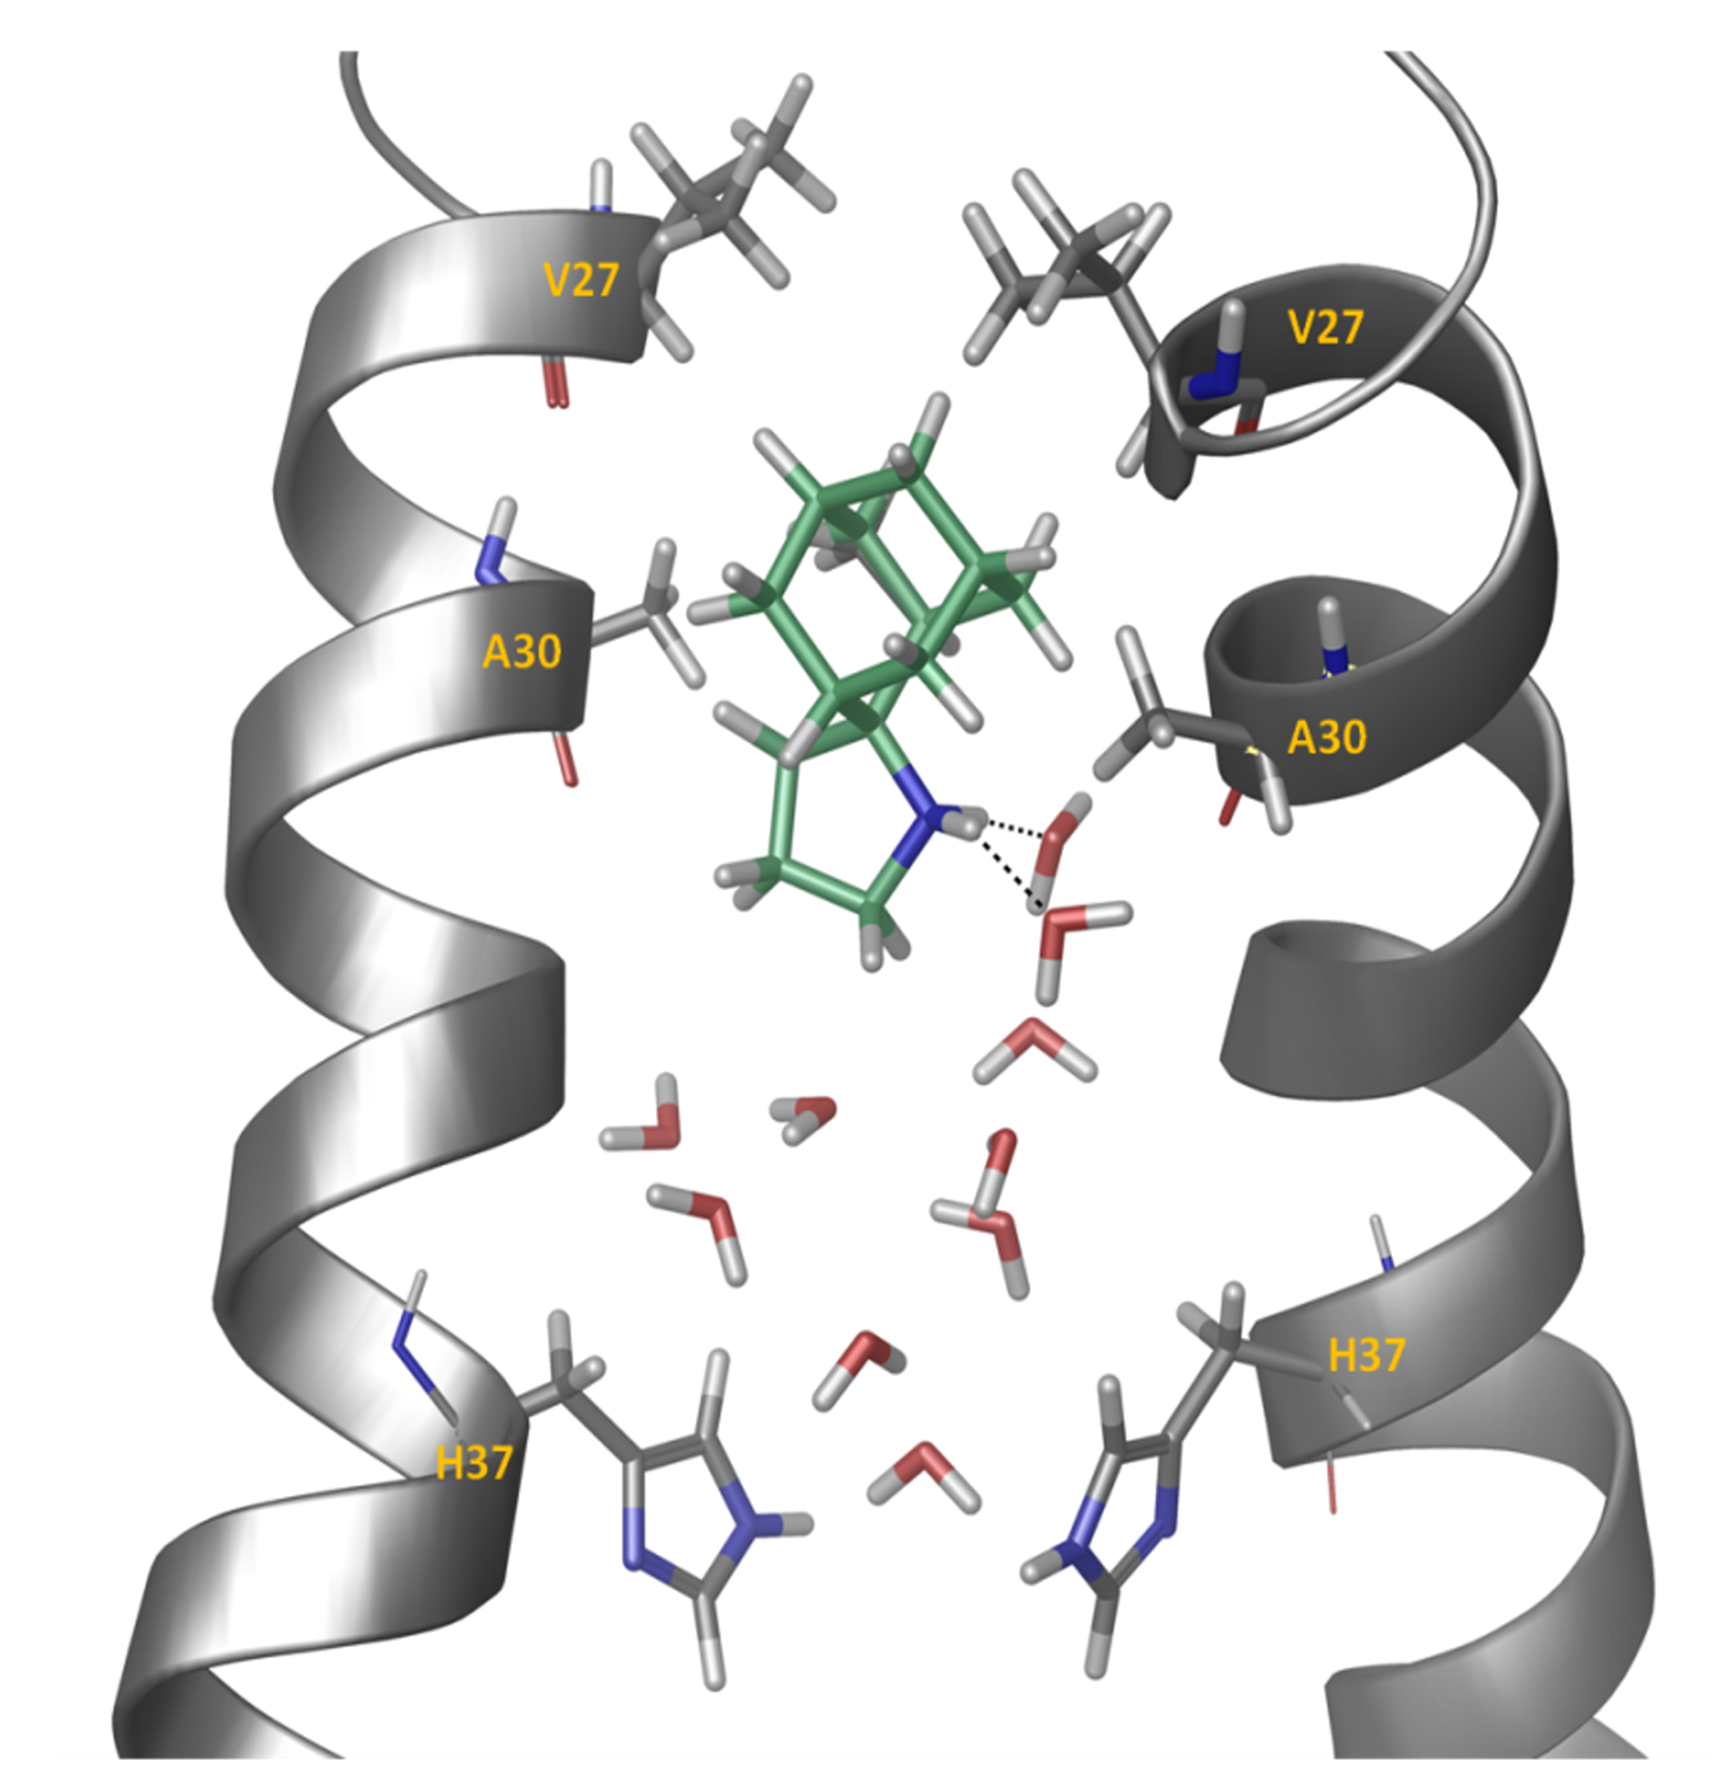
Figure 2. Representative snapshot from the simulation of spiro[pyrrolidine-2,2'-adamantane] bound to A/M2TM. Ten waters are shown between the ligand and His37 residues. Two hydrogen bonds between the ammonium group of the ligand and two water molecules are shown. Hydrogen bonding together with van der Waals interactions of the adamantane core with Val27 and Ala30 stabilize the ligand inside the pore with its ammonium group oriented towards the C-end.
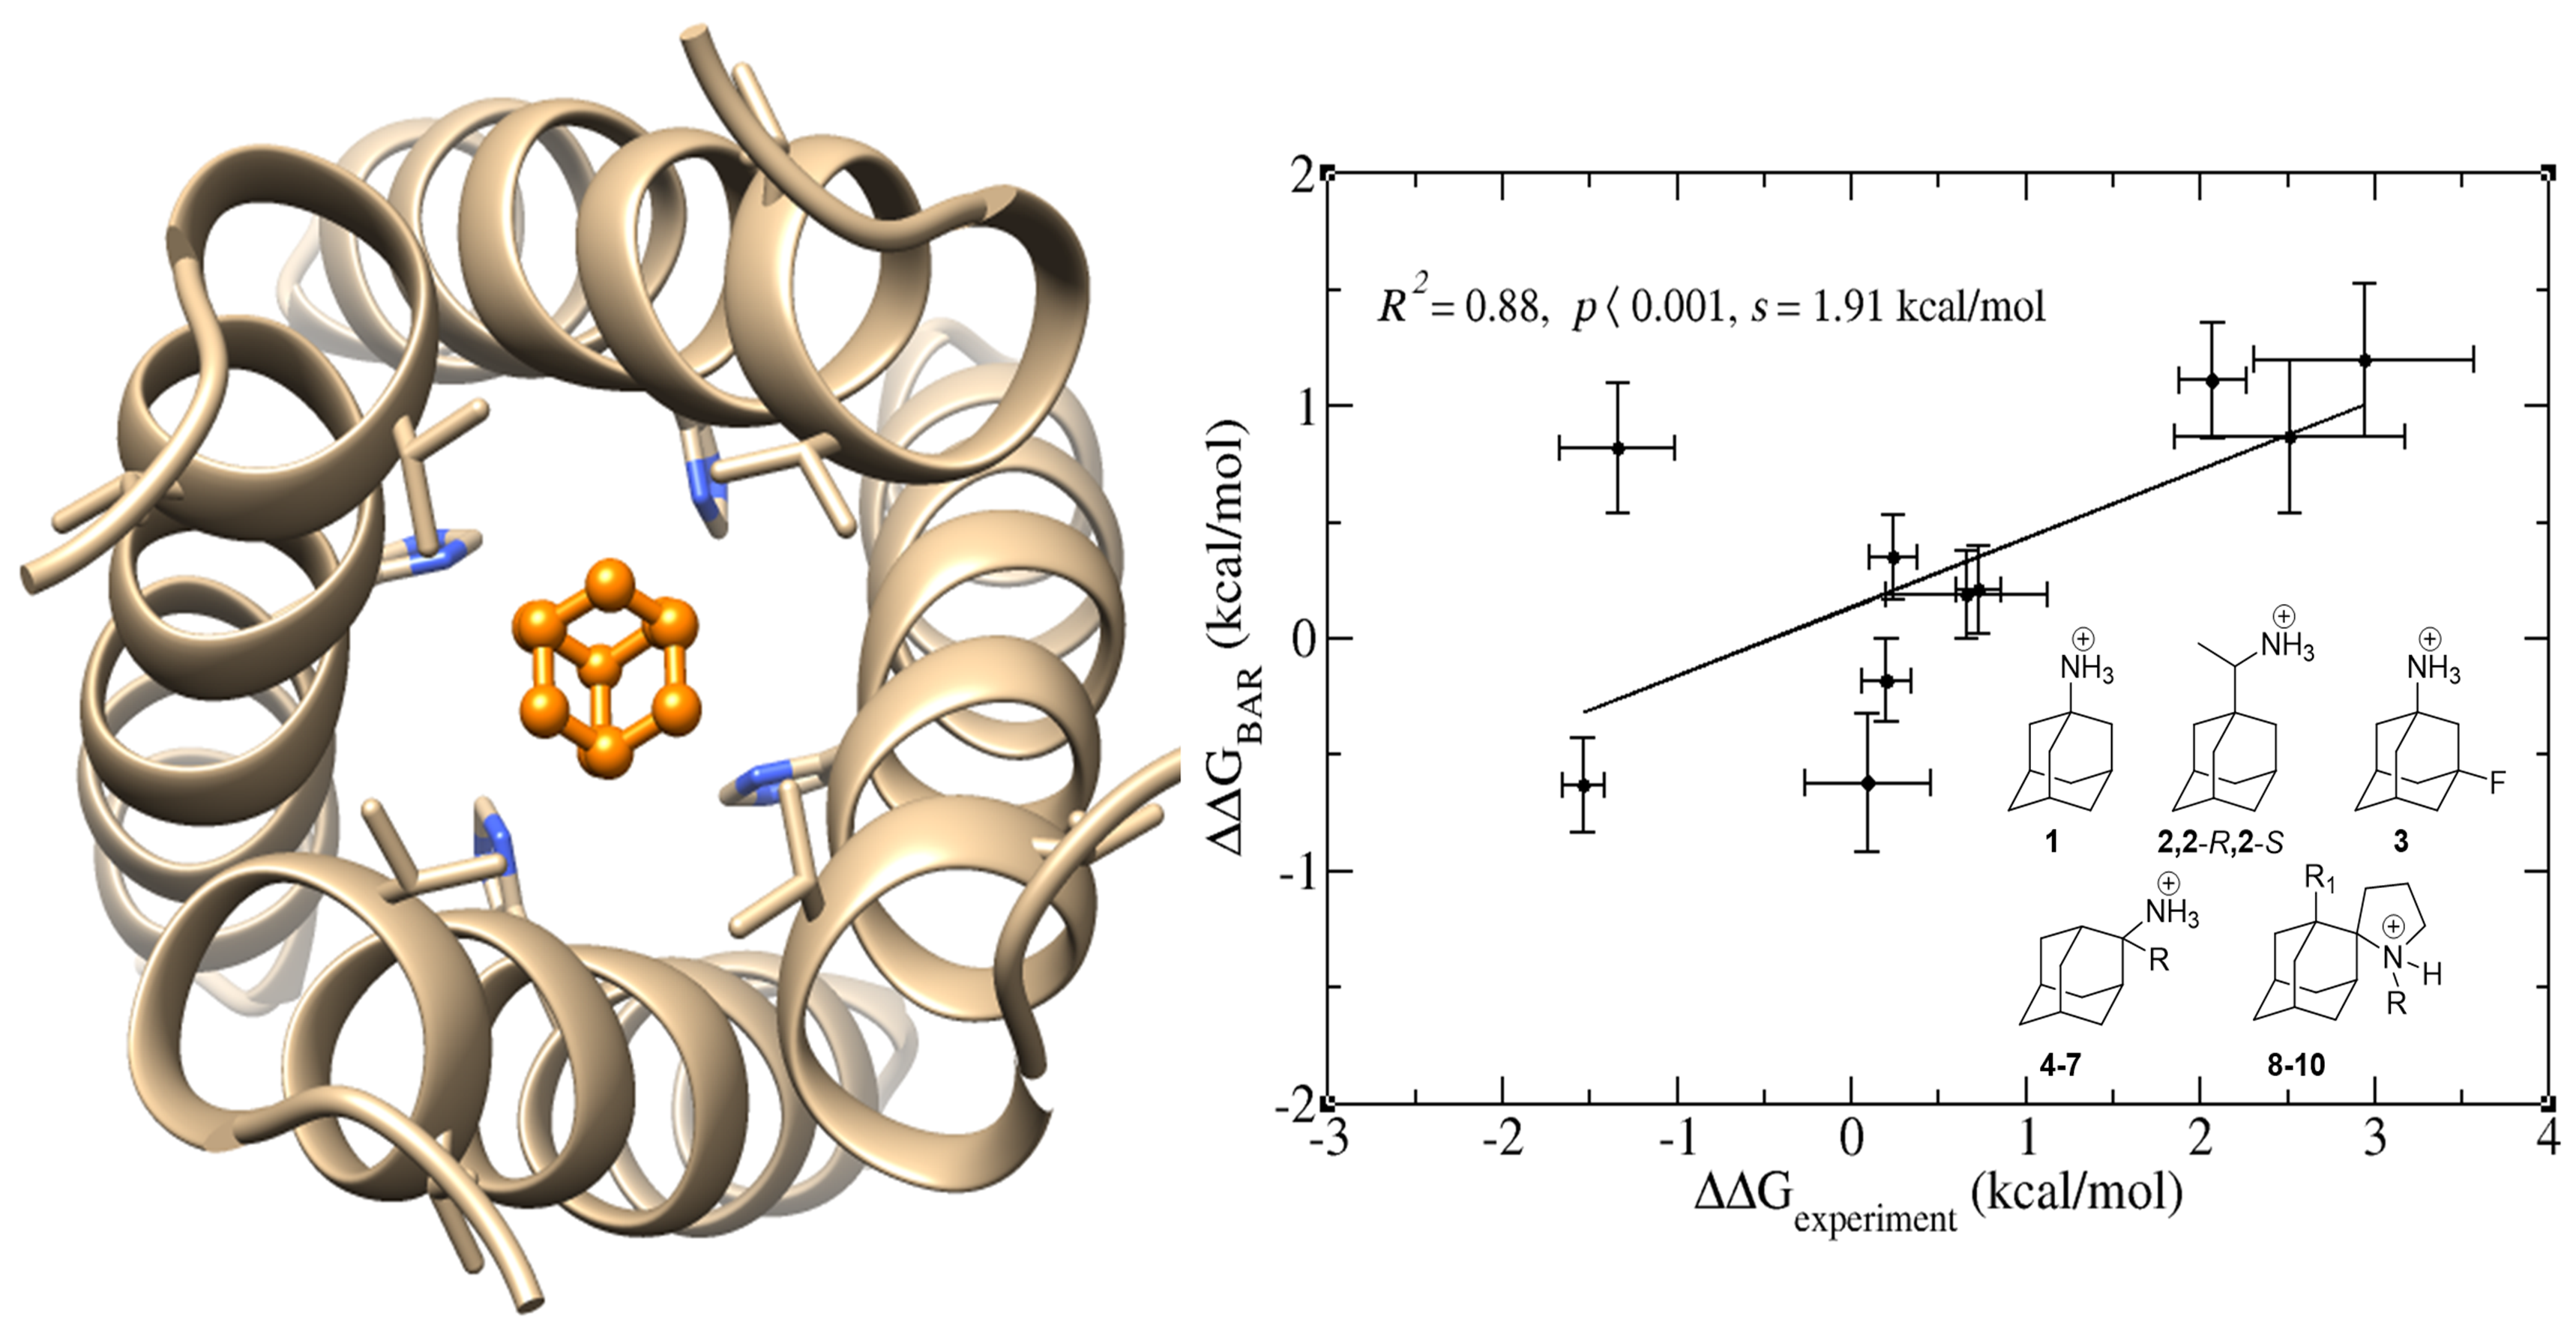
Figure 3. Relative binding free energies computed by the BAR approach (ΔΔGBAR) plotted against relative binding free energies derived from ITC data (ΔΔGexperiment) for M2TMUdorn embedded in a DMPC bilayer. The correlation line obtained by a linear least-squares fit including all data points are shown (solid, black line). Maximal errors in ΔΔGBAR and ΔΔGexperiment are shown as error bars along the vertical and horizontal axes, respectively. In the panel the square correlation coefficient (R2), the p value, and the slope (s) of the least-squares fit line is included. The method predicts nicely relative binding affinities with good to high orrelation and the results are encouraging for design new molecules.
♦ The synthesis of (a) labeled ligands, (b) M2TM peptides and, (c) M2TM peptides including 19F or d-labels (Figures 4, 5) using solid phase peptide synthesis were realized in my lab (currently the label free peptides are synthesized in collaboration with Assoc. Professor T. Tselios, Patras) for studying the M2TM-ligand complexes using biophysical methods (ITC, NMR etc).
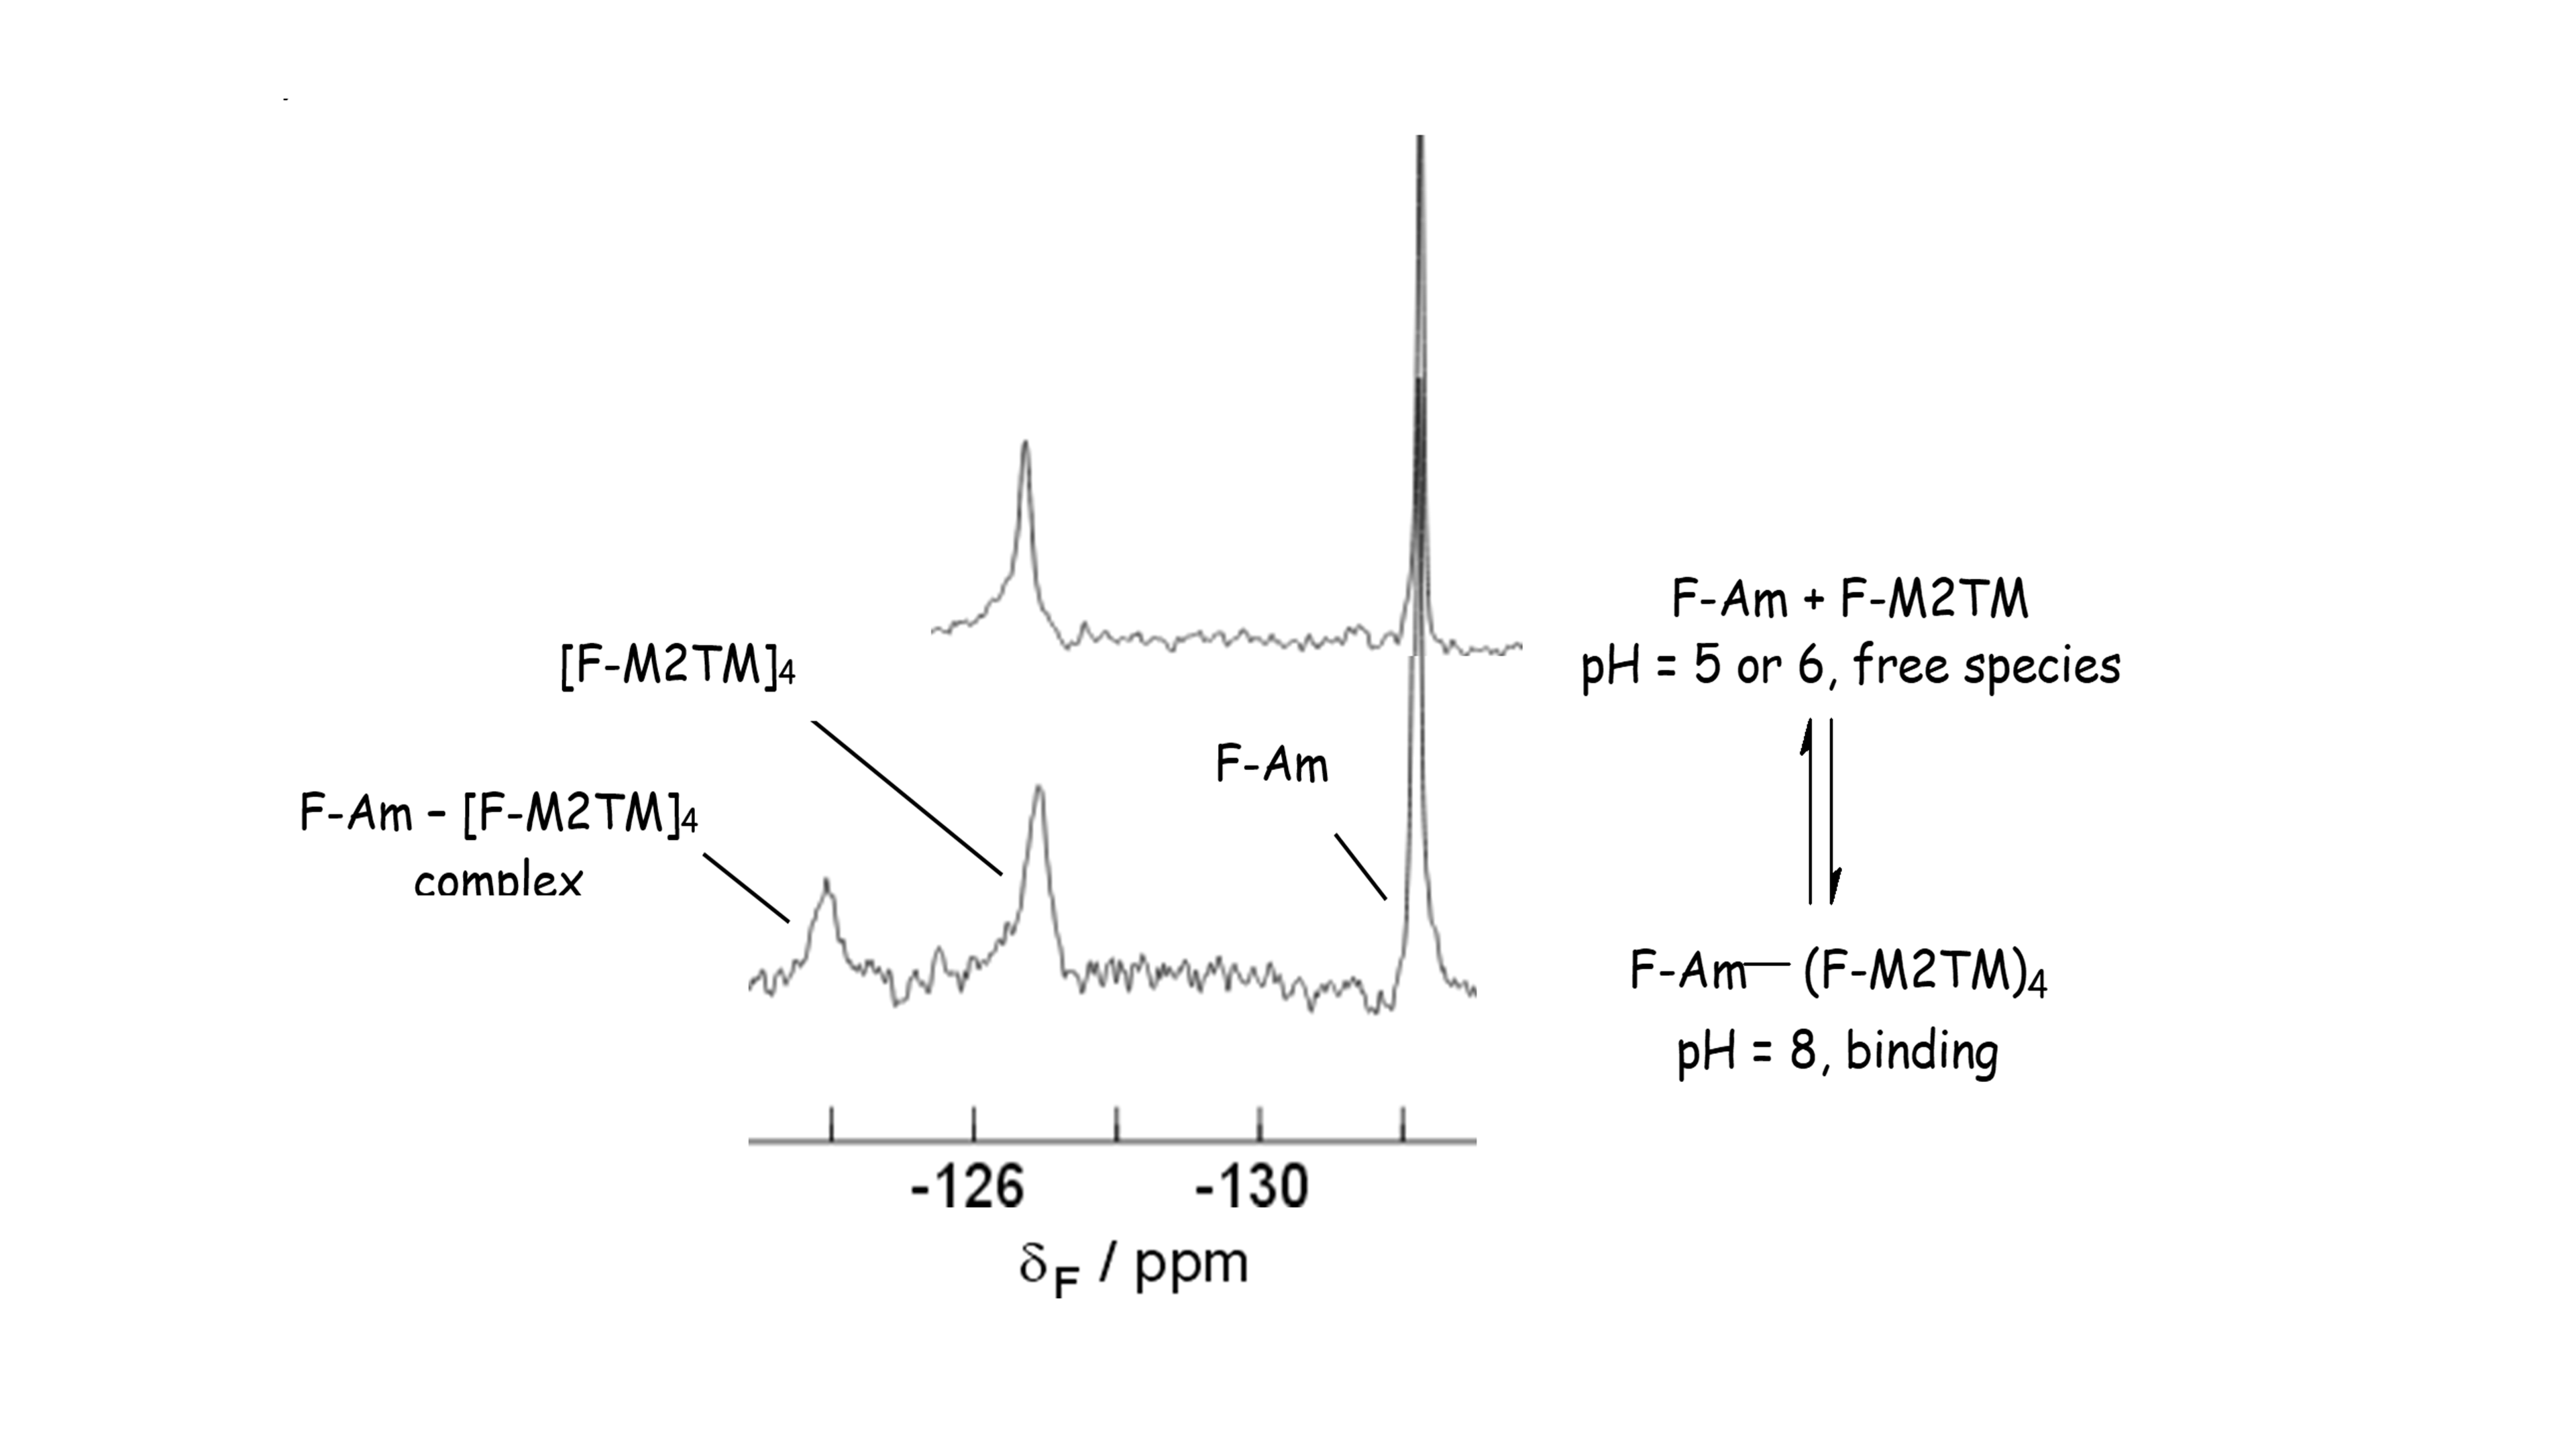
Figure 4. Interaction between a fluorine labeled Amt analog (F-Am) and the fluorine tryptophane-labeled influenza A M2TM receptor peptide (F-M2TM) probed by 19F NMR spectroscopy of the receptor
♦ Investigation of the structure of the M2TM WT pore in complex with Aamt ligands and the molecular basis of resistance to Aamt drugs in M2 S31N, M2 V27A etc using high resolution X-ray crystallography (in collaboration with B. DeDrado, UCSF and T. Papageorgiou, Turku, Finland) and accurate MD simulations performed in my lab (Figures 6-8).
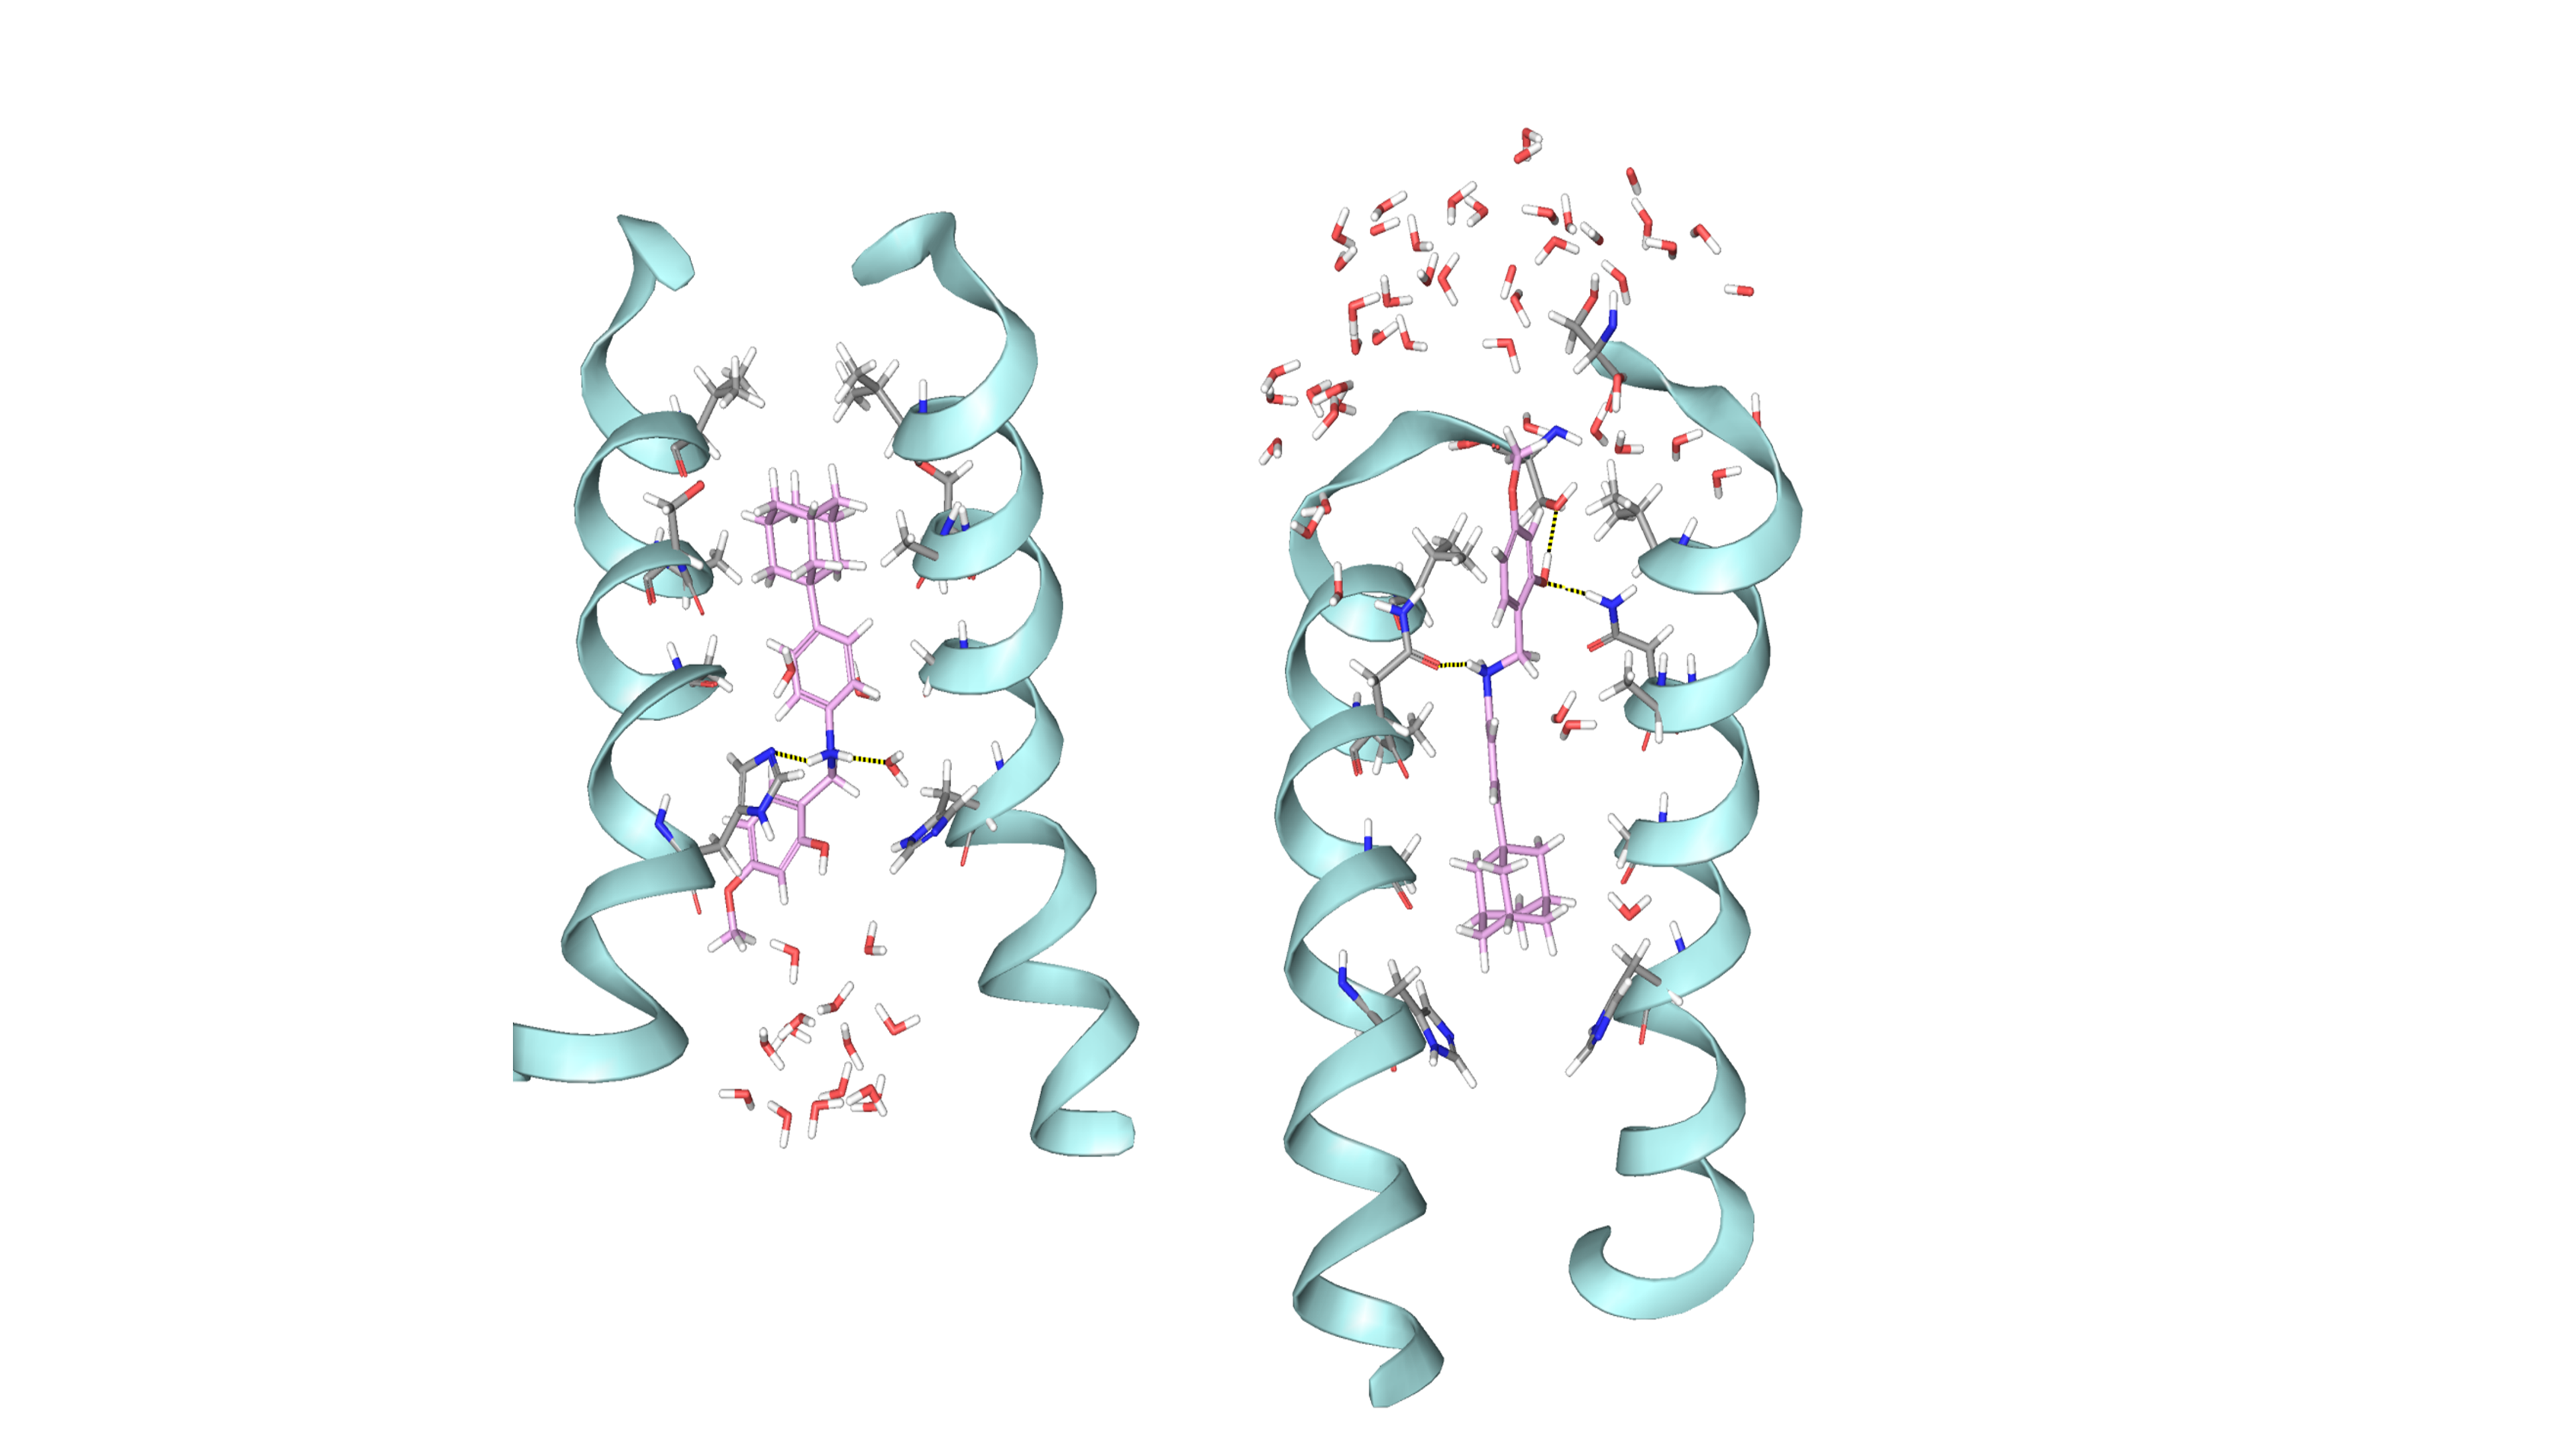
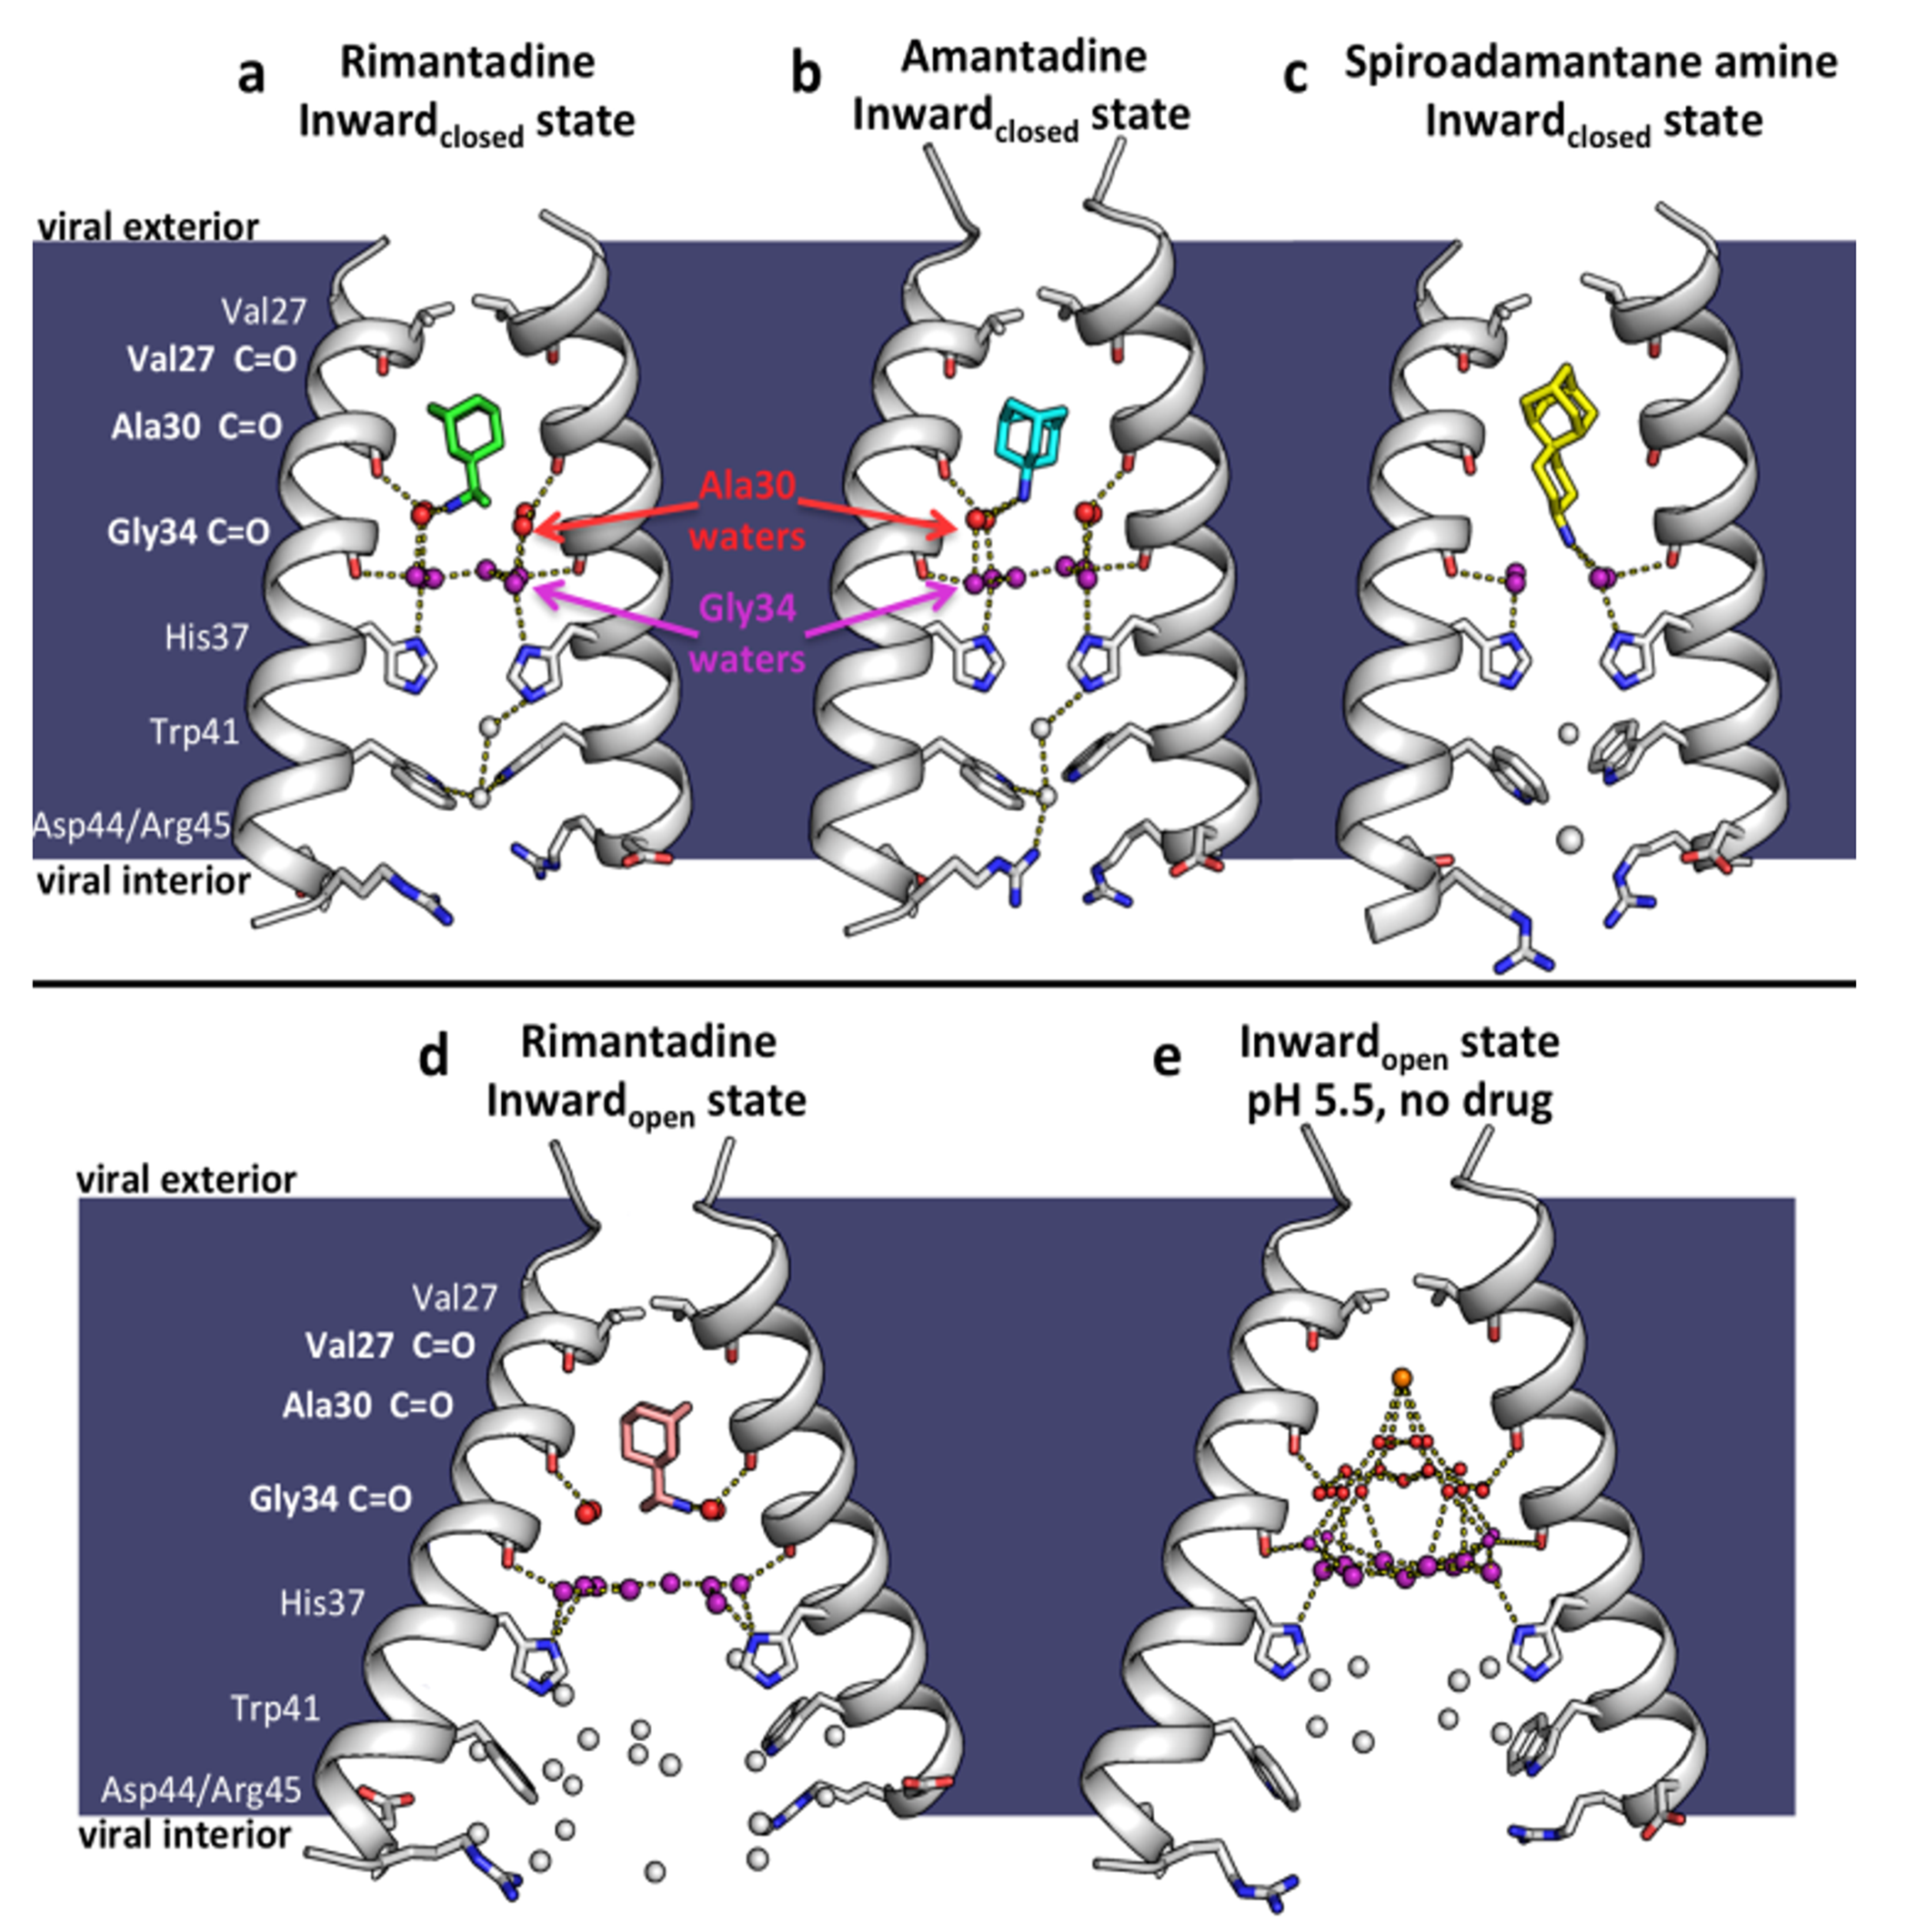
Figure 6. X-ray crystal structures of the M2 proton channel bound to drugs and inhibitors. The channel is a homotetramer, but here the front and back monomers have been removed to show the contents of the channel pore. Hydrogen bonds are shown as yellow dashes. The layer of waters forming H-bonds to Ala30 carbonyls ("Ala30 layer") is shown as red spheres; the layer of waters forming H-bonds to Gly34 carbonyls ("Gly34 layer") is shown as purple spheres. Top, left to right: a. M2 bound to rimantadine in the Inwardclosed state; PDB code 6BKL, 2.00 Å resolution, monomer subunits F and H; b. M2 bound to amantadine in the Inwardclosed state; 6BKK, 2.00 Å resolution, monomers B and D; c. M2 bound to spiro-adamantyl amine in the Inwardclosed state; 6BMZ, 2.63 Å resolution, monomers B and D. Bottom, left to right: d. M2 bound to rimantadine in the Inwardopen state; 6BOC, 2.25 Å resolution, monomers B and D; e. Previously solved structure of M2 in the Inwardopen state at pH 5.0 in the absence of bound drug, 5JOO, 1.41 Å resolution.
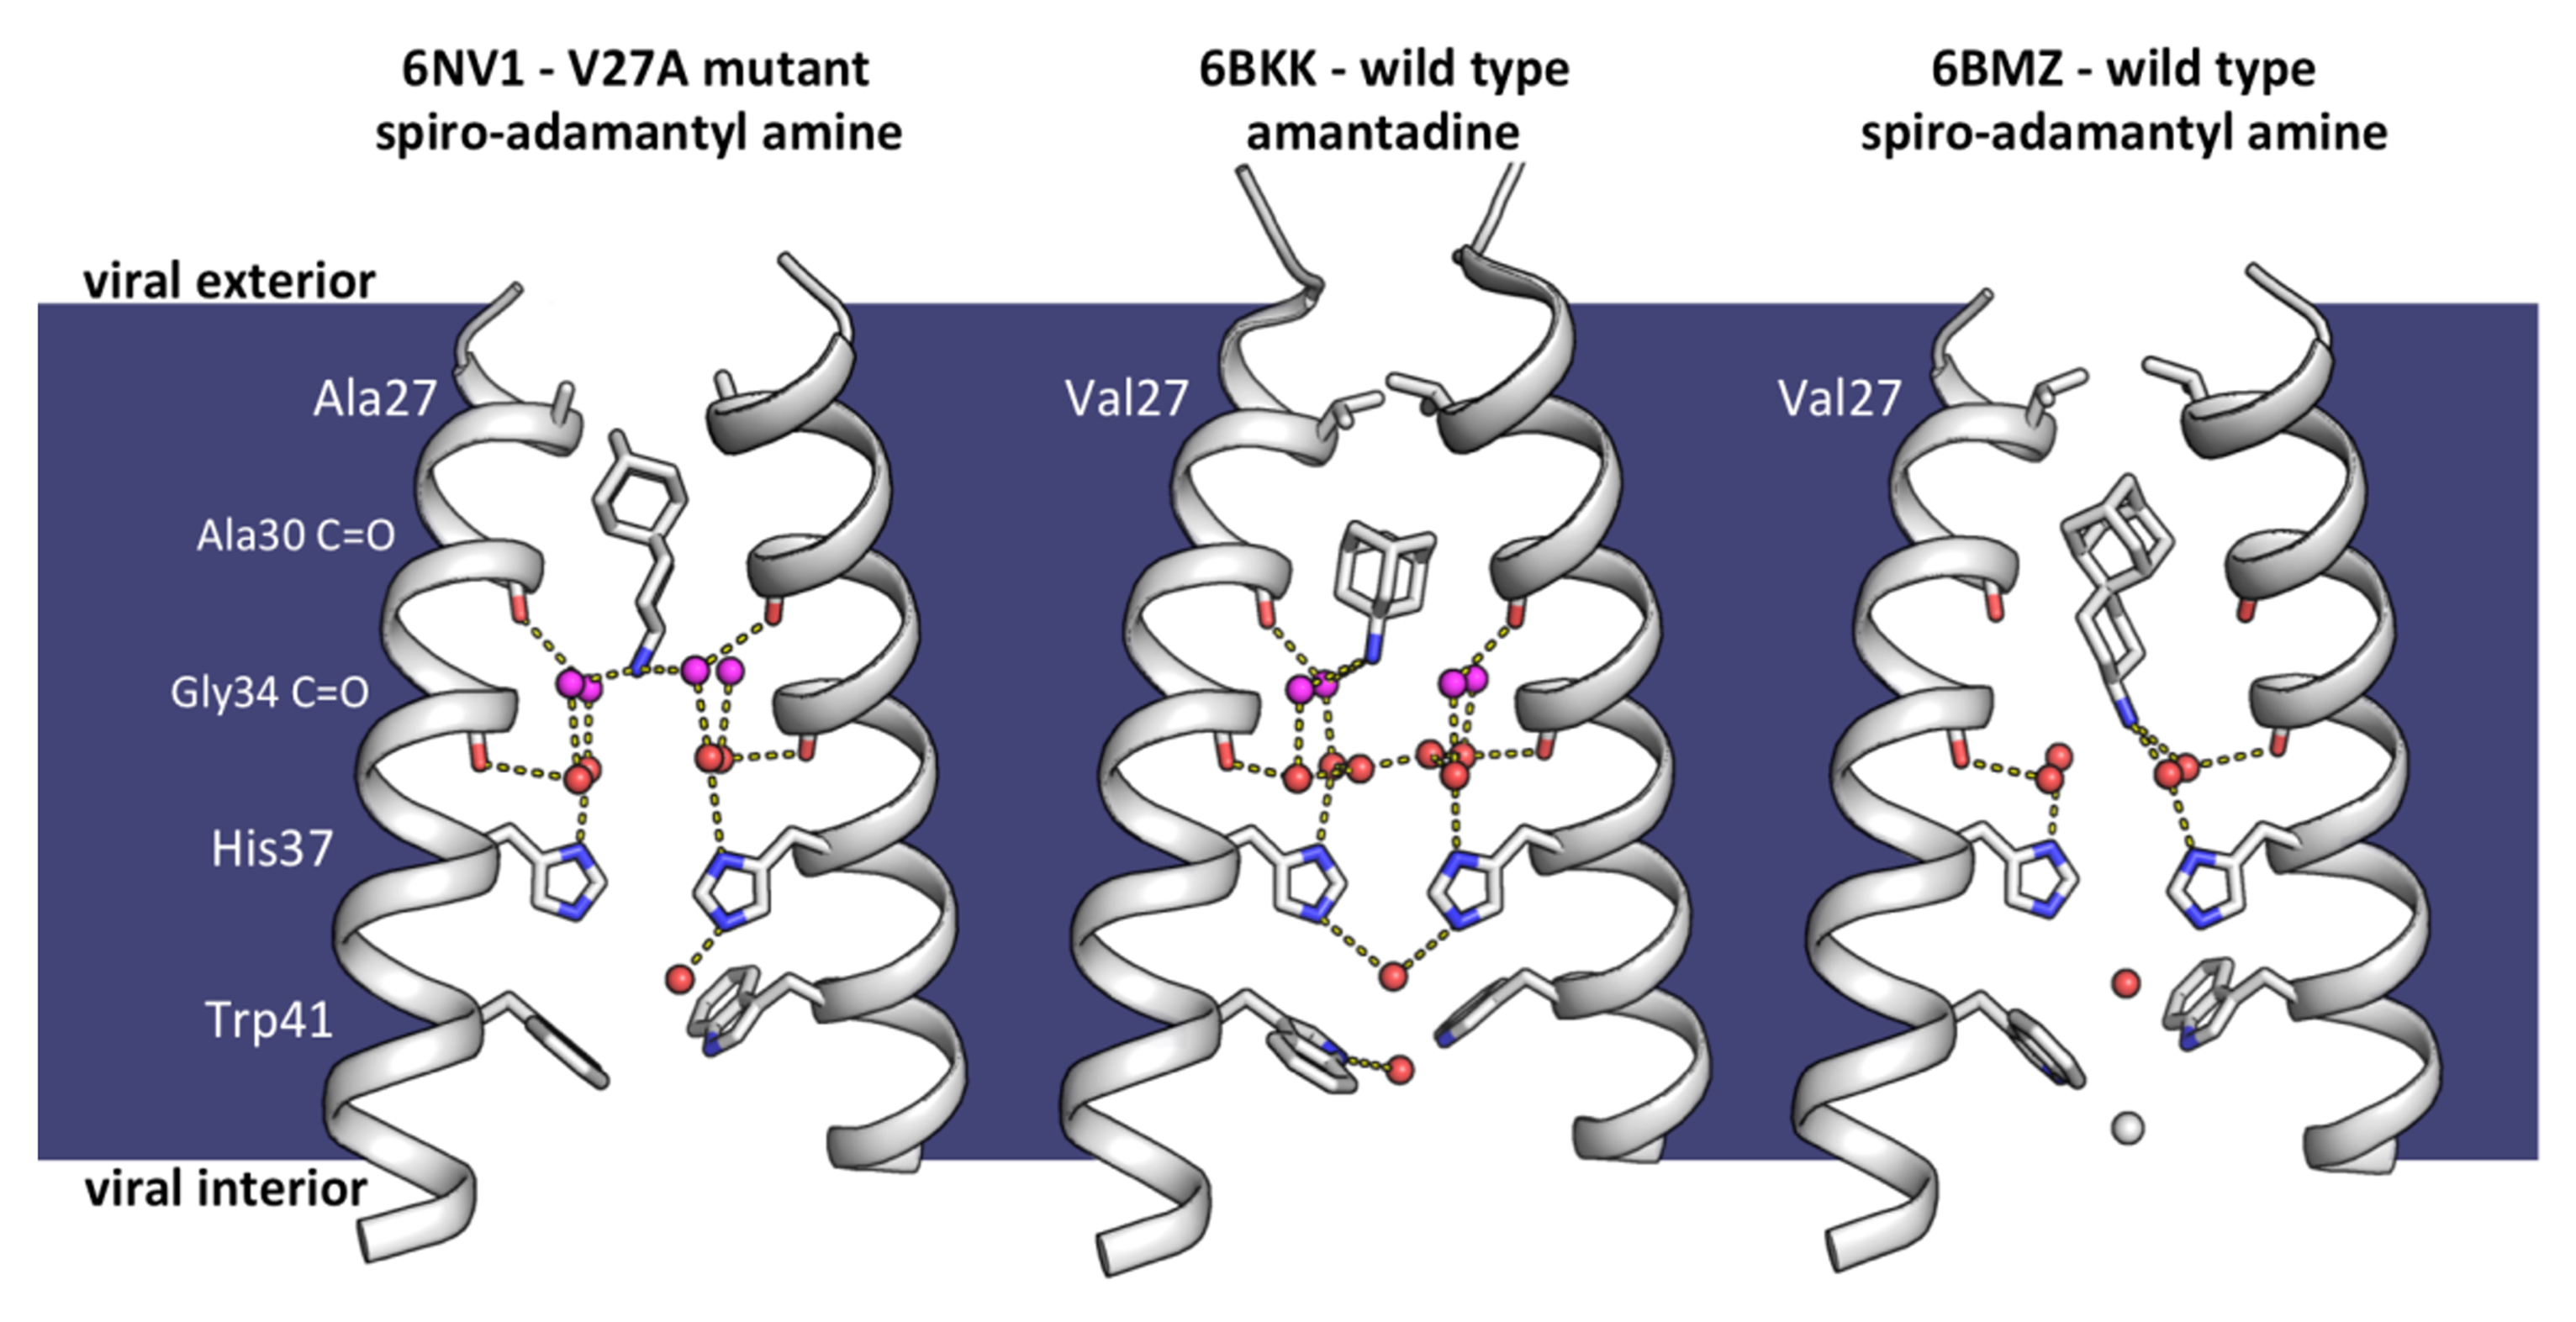
Figure 7. Mechanism of adamantane resistance in the V27A mutant channel, and mechanism of dual inhibition by spiro-adamantyl amine. Left to right: Newly solved structure of M2(22-46) V27A bound to a spiro-adamantyl amine inhibitor (6NV1, monomer chains B and D), M2(22-46) WT bound to amantadine (6BKK, chains B and D), and M2(22-46) WT bound to spiro-adamantyl amine (6BMZ, chains B and D). Front and back monomer helices have been removed to clearly show the contents of the channel pore. When spiro-adamantyl amine binds to the V27A channel (6NV1), the ammonium group of the inhibitor localizes to the same position as the ammonium of amantadine in the wild type structure (6BKK). The adamantyl group is positioned higher in the channel pore, occupying the extra space created by the Val27 to Ala mutation. In the previously solved structure of spiro-adamantyl amine inhibitor bound to the wild type channel (6BMZ), the adamantyl group of the inhibitor binds lower in the channel pore, and the four waters in the Ala30 solvent layer are displaced. A network of one or two layers of hydrogen-bonded waters in the Ala30 or Ala30 and Gly34 is formed depending whether Val or Ala are present at position 27.
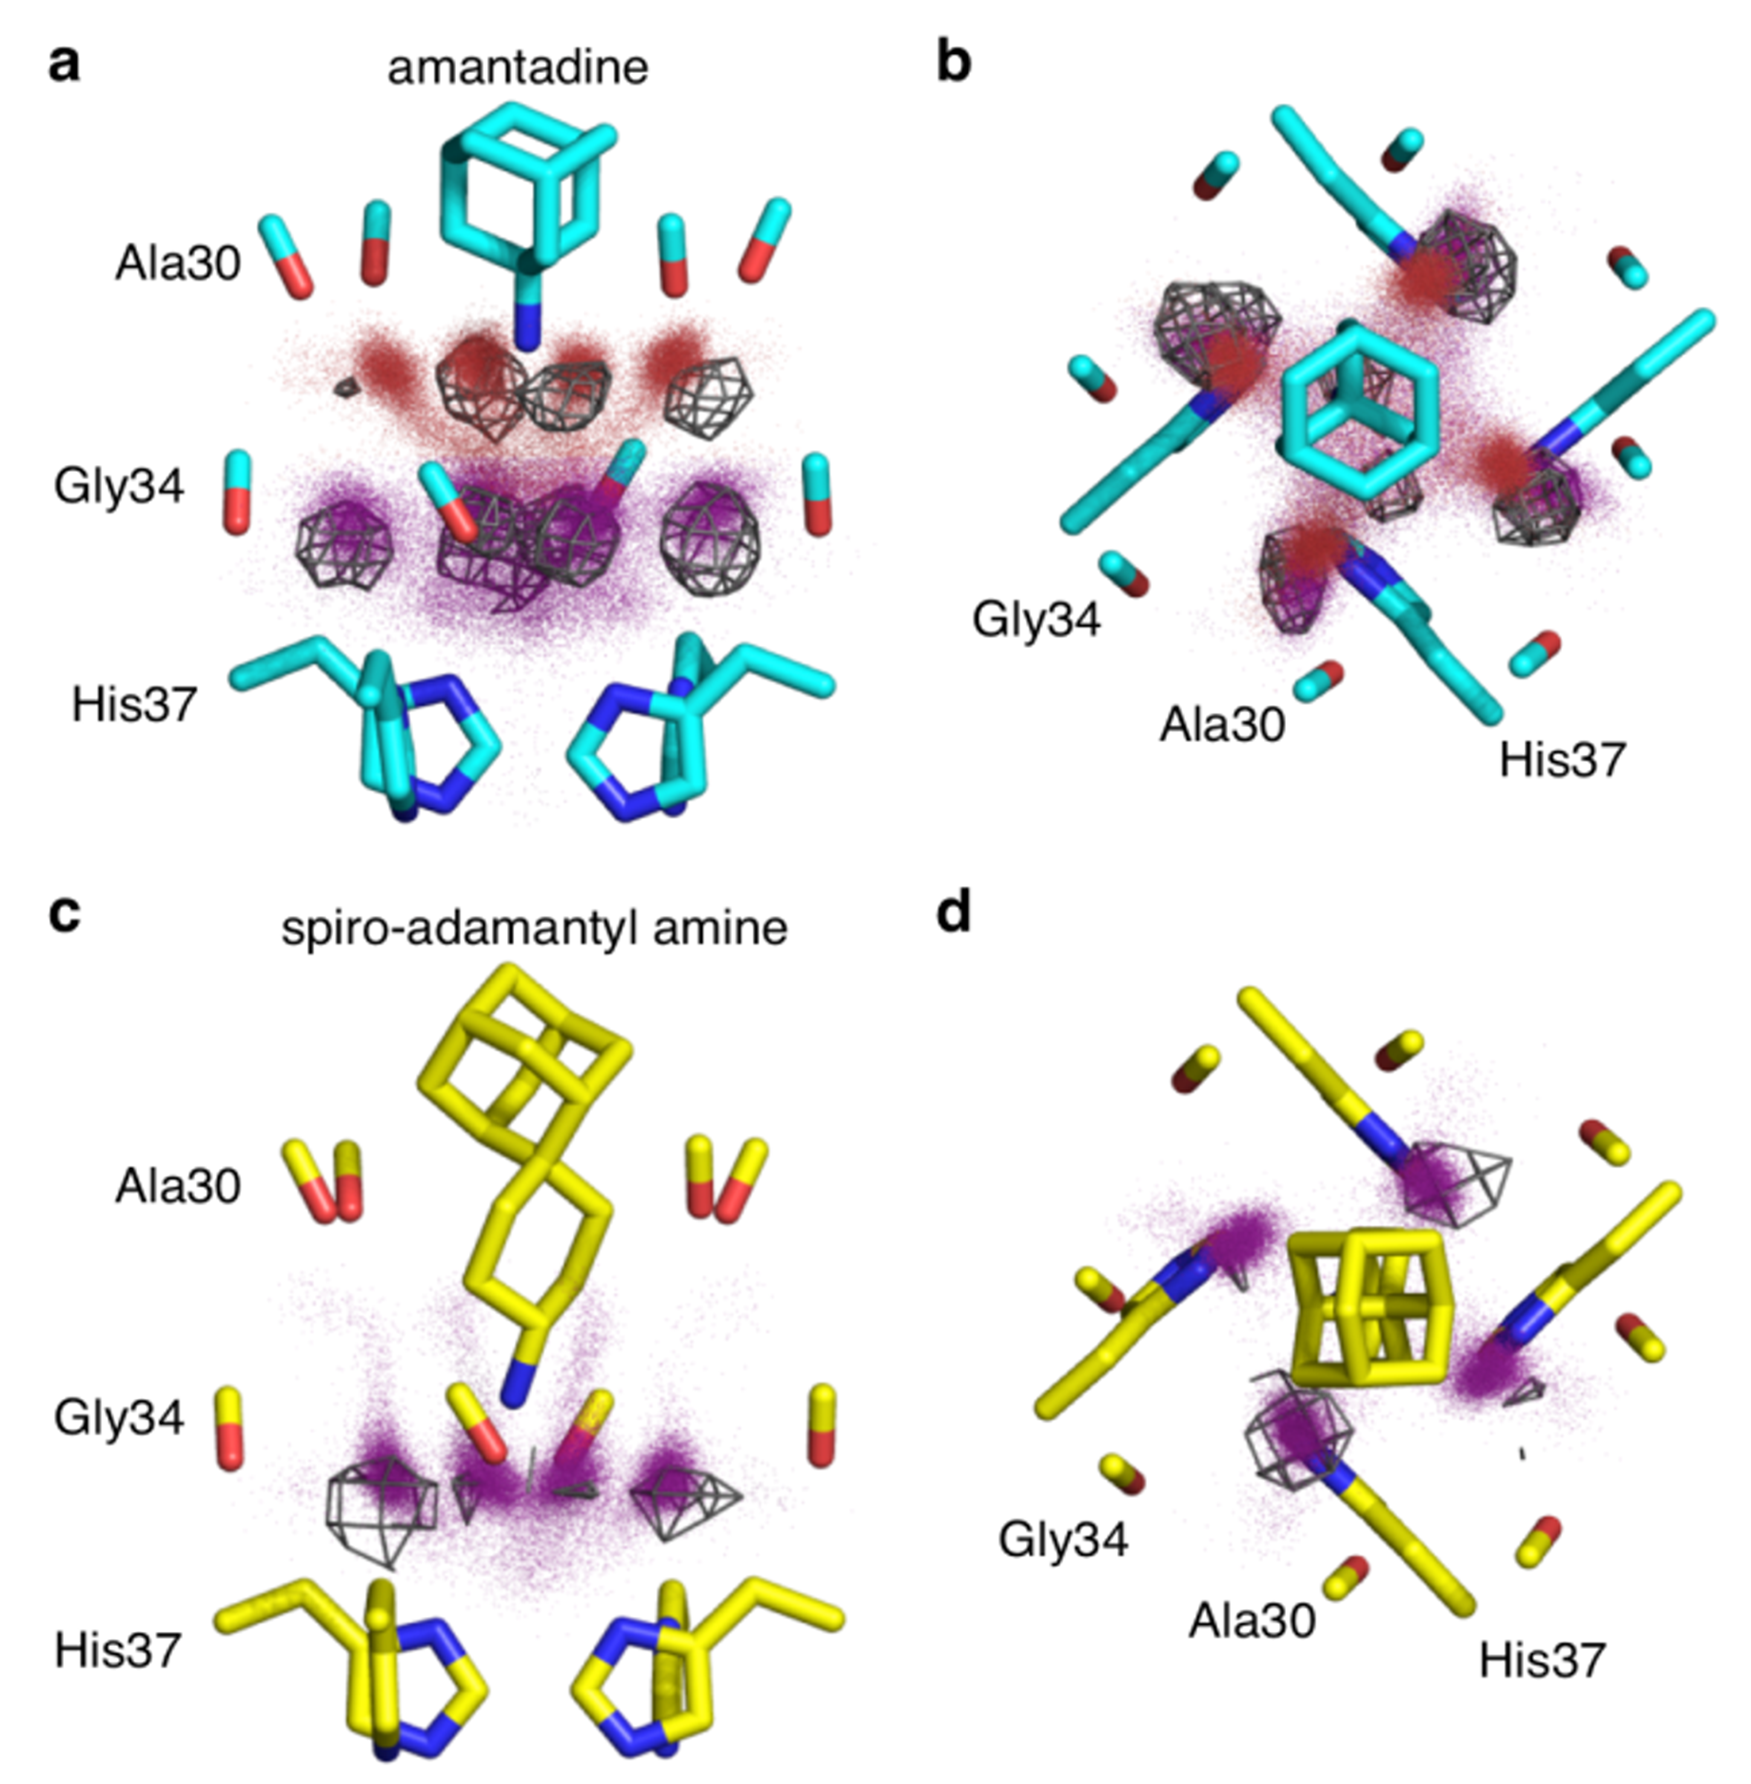
Figure 8. MD simulations performed in our lab reproduce accurately the number and the positions of the crystallographic waters. X-ray crystal structures are shown as sticks. Red and purple dots are water oxygen positions from MD snapshots of the largest amine clusters. Gray wireframe shows contours of water electron density from the X-ray crystal structure. a,c: Side views. b,d: Top views.
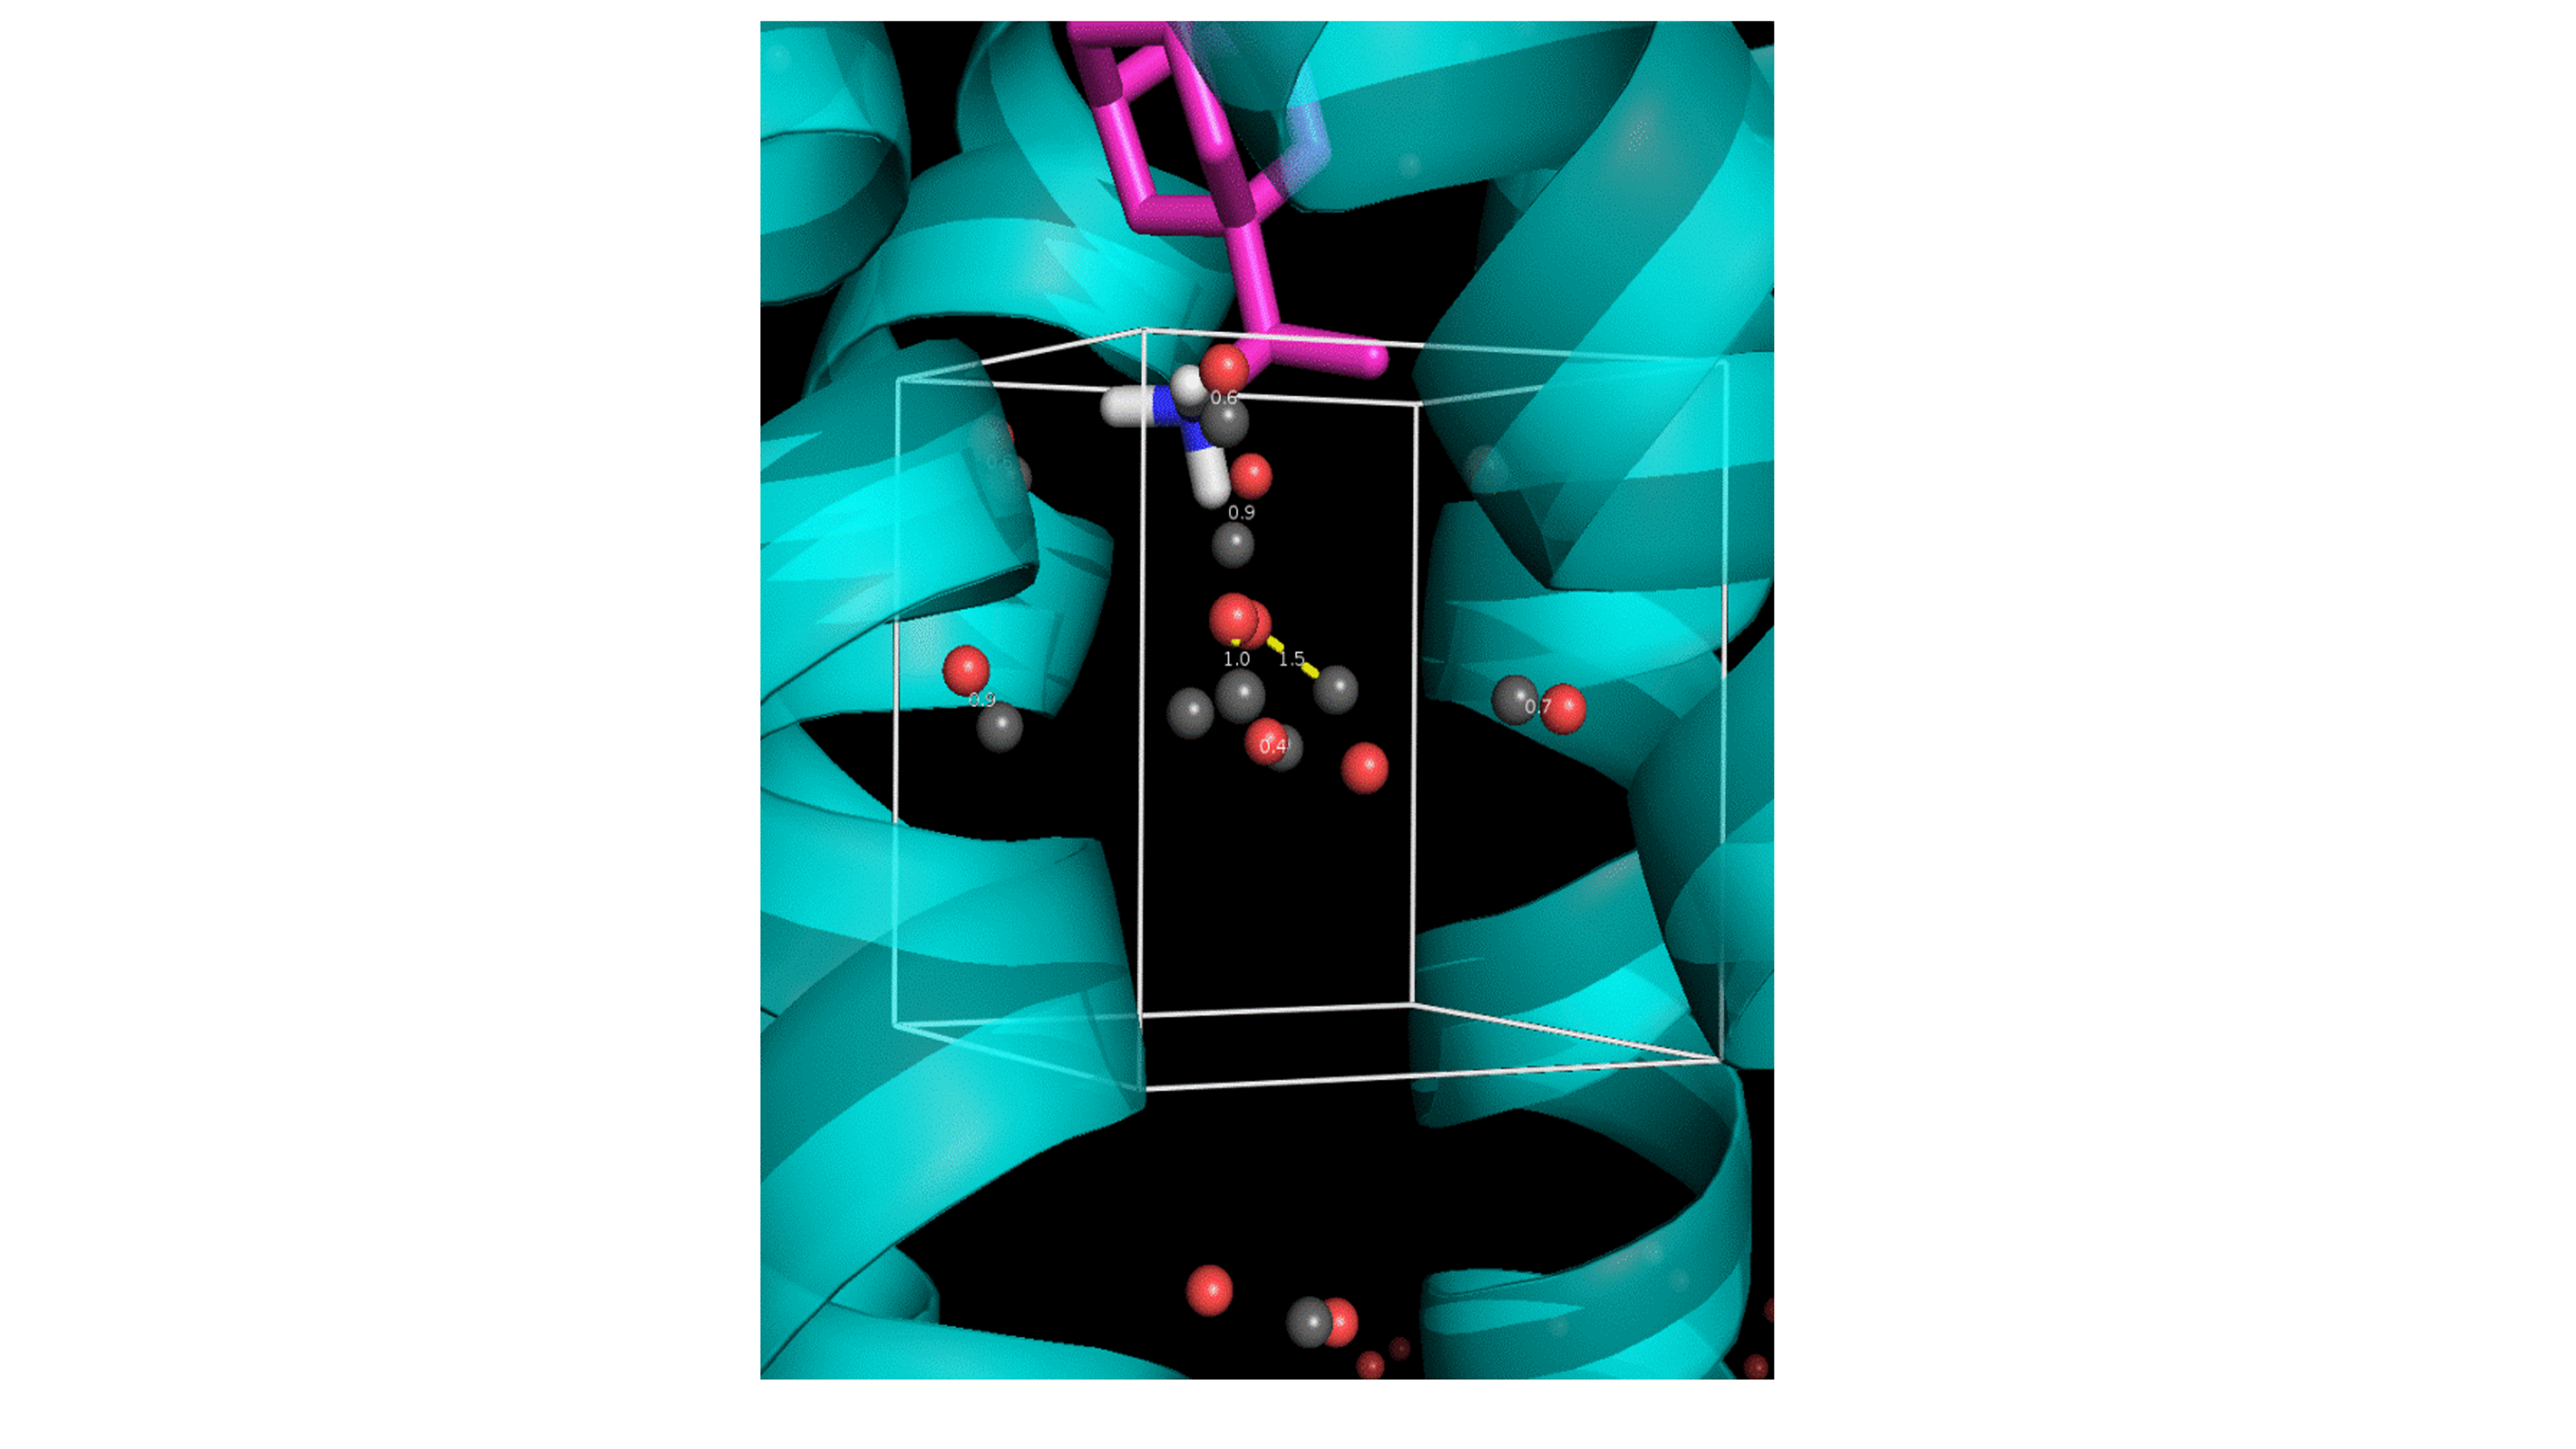
♦ Simulation of tightly-bound water molecules in mediating protein-ligand interactions in the X-ray structures of M2TM - ligand complexes, and calculation of their binding free energies by considering each water separately from the others using Monte Carlo sampling for the MD simulations and free energy calculations (in collaboration with Professor Jonathan Essex, Southampton; see Water Sites, Networks, And Free Energies with Grand Canonical Monte Carlo. Ross, G. A.; Bodnarchuk, M.S.; Essex, J. W. J. Am. Chem. Soc. 2015, 137, 14930-43). This information suggests which water molecule is most flexible to be displaced for drug design purposes (Figure 9).
Figure 9. Box used for Monte Carlo simulations. In grey are showed the oxygen atom of waters positions from our simulations which perfectly match the crystallographic positions and in red the water positions produces with Monte Carlo simulations.
♦ Measurement of kon, koff using EP for understanding kinetics of binding and identifying the structure of drugs (Scheme 8) that bind but possibly have high koff leading to non-potent molecules (in collaboration with Professor Dave Busath, USA).
♦ In combination the synthesis of chemical probes in adamantane series (Scheme 7) for investigating binding to M2 S31N and M2 WT channels using electrophysiology and kinetics of binding (in collaboration with Professor Dave Busath, USA), antiviral assays (Michaela Schmidtke, Germany) and biomolecular simulations (Figures 10-13).
For example, compounds 2-5 show significant block of inward current in the M2 WT channel fast association rate kon, and slow dissociation rate koff (Table 1). In the M2 S31N channel (Table 2), the percent inward current block by compounds 2-5 is significantly reduced (compared to WT, Table 2), with compound 2 showing no measurable block. This is clearly due to the nearly 5- to 10-fold reduction in kon for compounds 3-5, and nearly 10- to 30-fold increase in koff for compounds 3-5. Therefore, with slow association rates and fast dissociation rates, the dissociation constant KD calculated from the fitted rate constants is above 100 µM for compounds 3-5 resulting in low binding affinity. Only compounds 1, 6 with high koff and low kon block M2. Also compound 1 block proton current in M2 S31N and M2 WT; compound 6 block proton current in M2 S31N but did not block M2 S31.
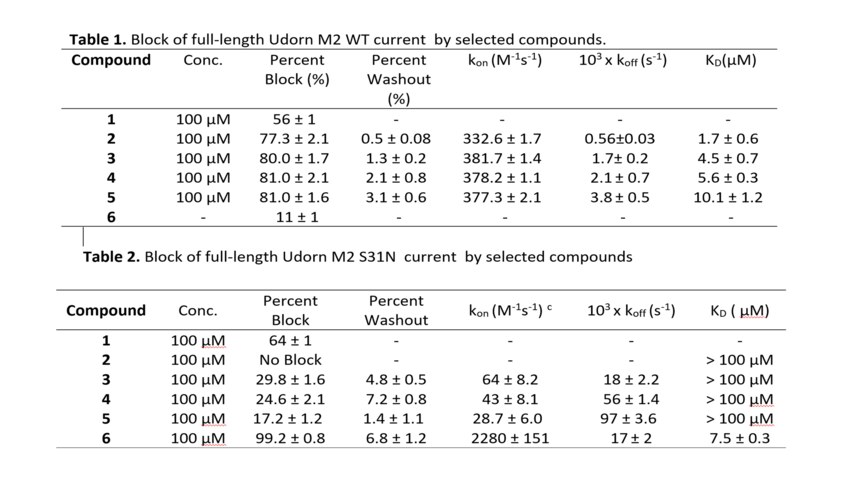
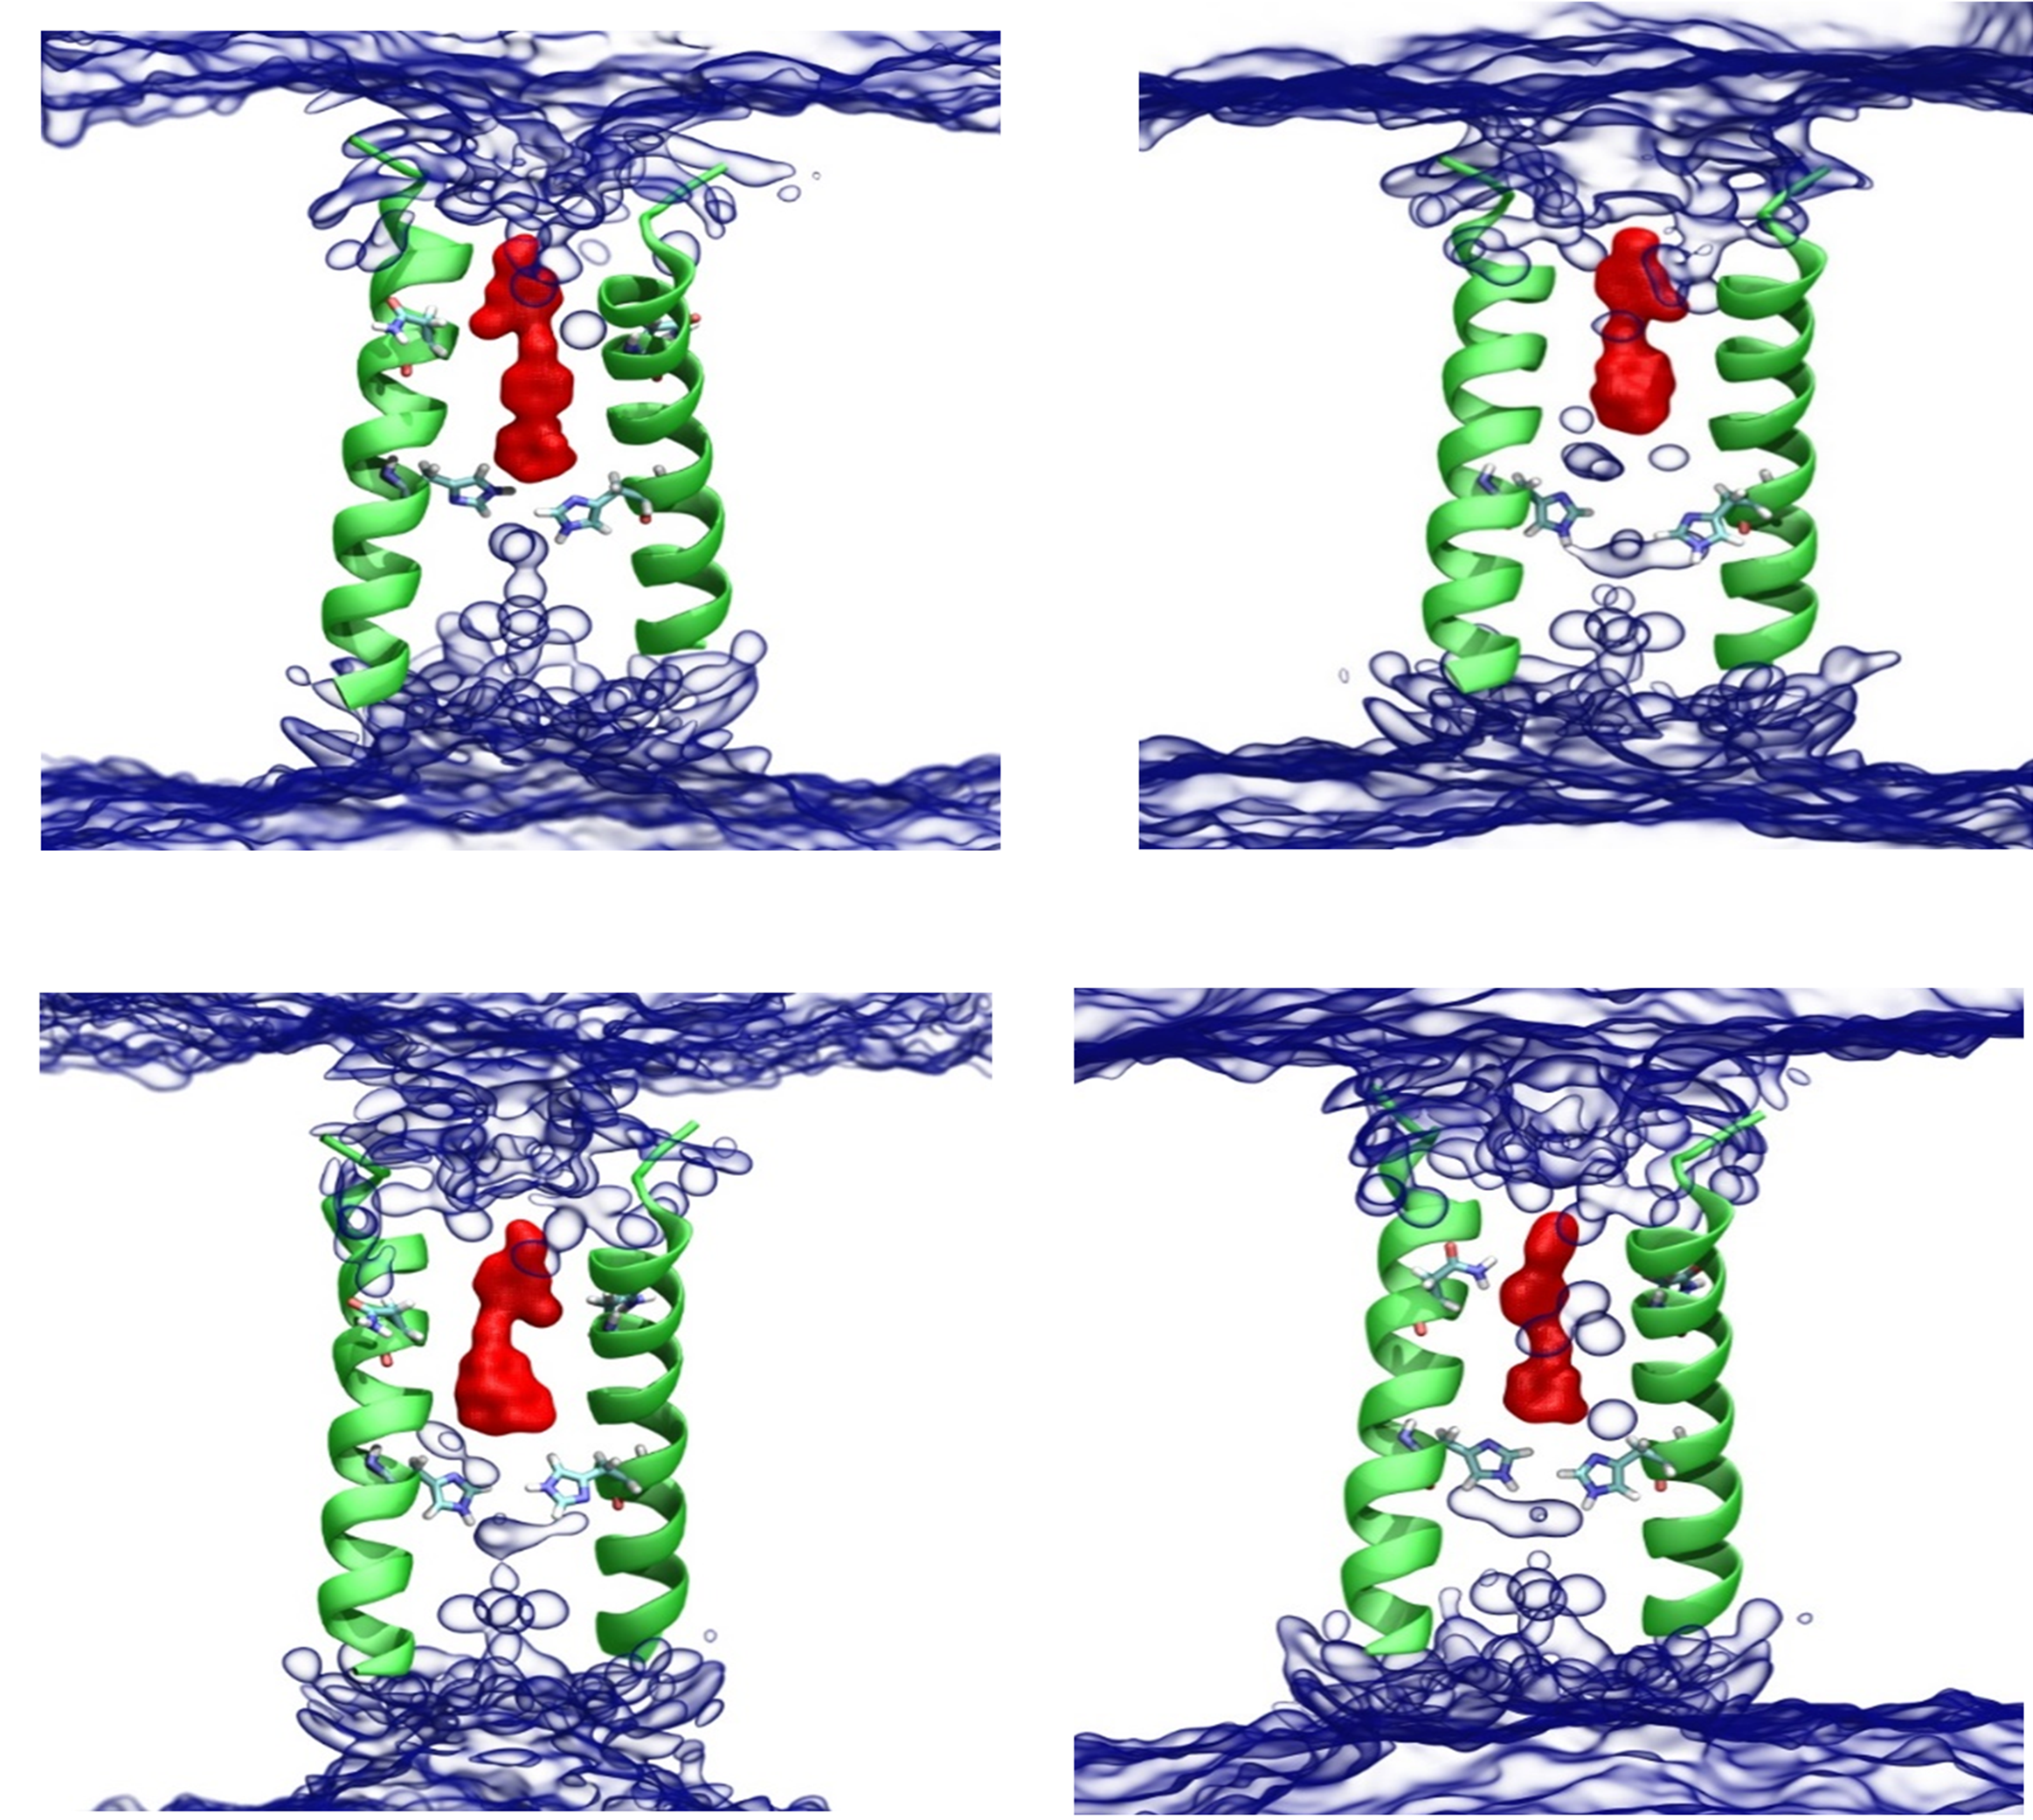
Compounds 3-5 get into the M2 S31N channel, they are fully effective at blocking the channel, and the low degree of block is due to their kinetics of binding, i.e. slow on rate constant, fast off rate constant. In contrast compound 6 exhibited fast on rate constant, fast off rate constant. MD simulations of 3-6 in complex with M2TM S31N showed that they bind in the M2TM S31N (Figure 12).
Figure 10. Aqueous access to the channel in the presence of compounds 3 (upper left), 4 (upper right), 5 (lower left) and 6 (lower right) in the M2TM S31N (2KQT mutated with S31N) in a DMPCbilayer from 100 ns of MD simulation. Average water positions (blue, QuickSurf blown glass), ligand positions (red, isosurface with isovalue 0.45), and protein positions (green, first and third segments of 2KQT structure 17 aligned to the protein volume slice).
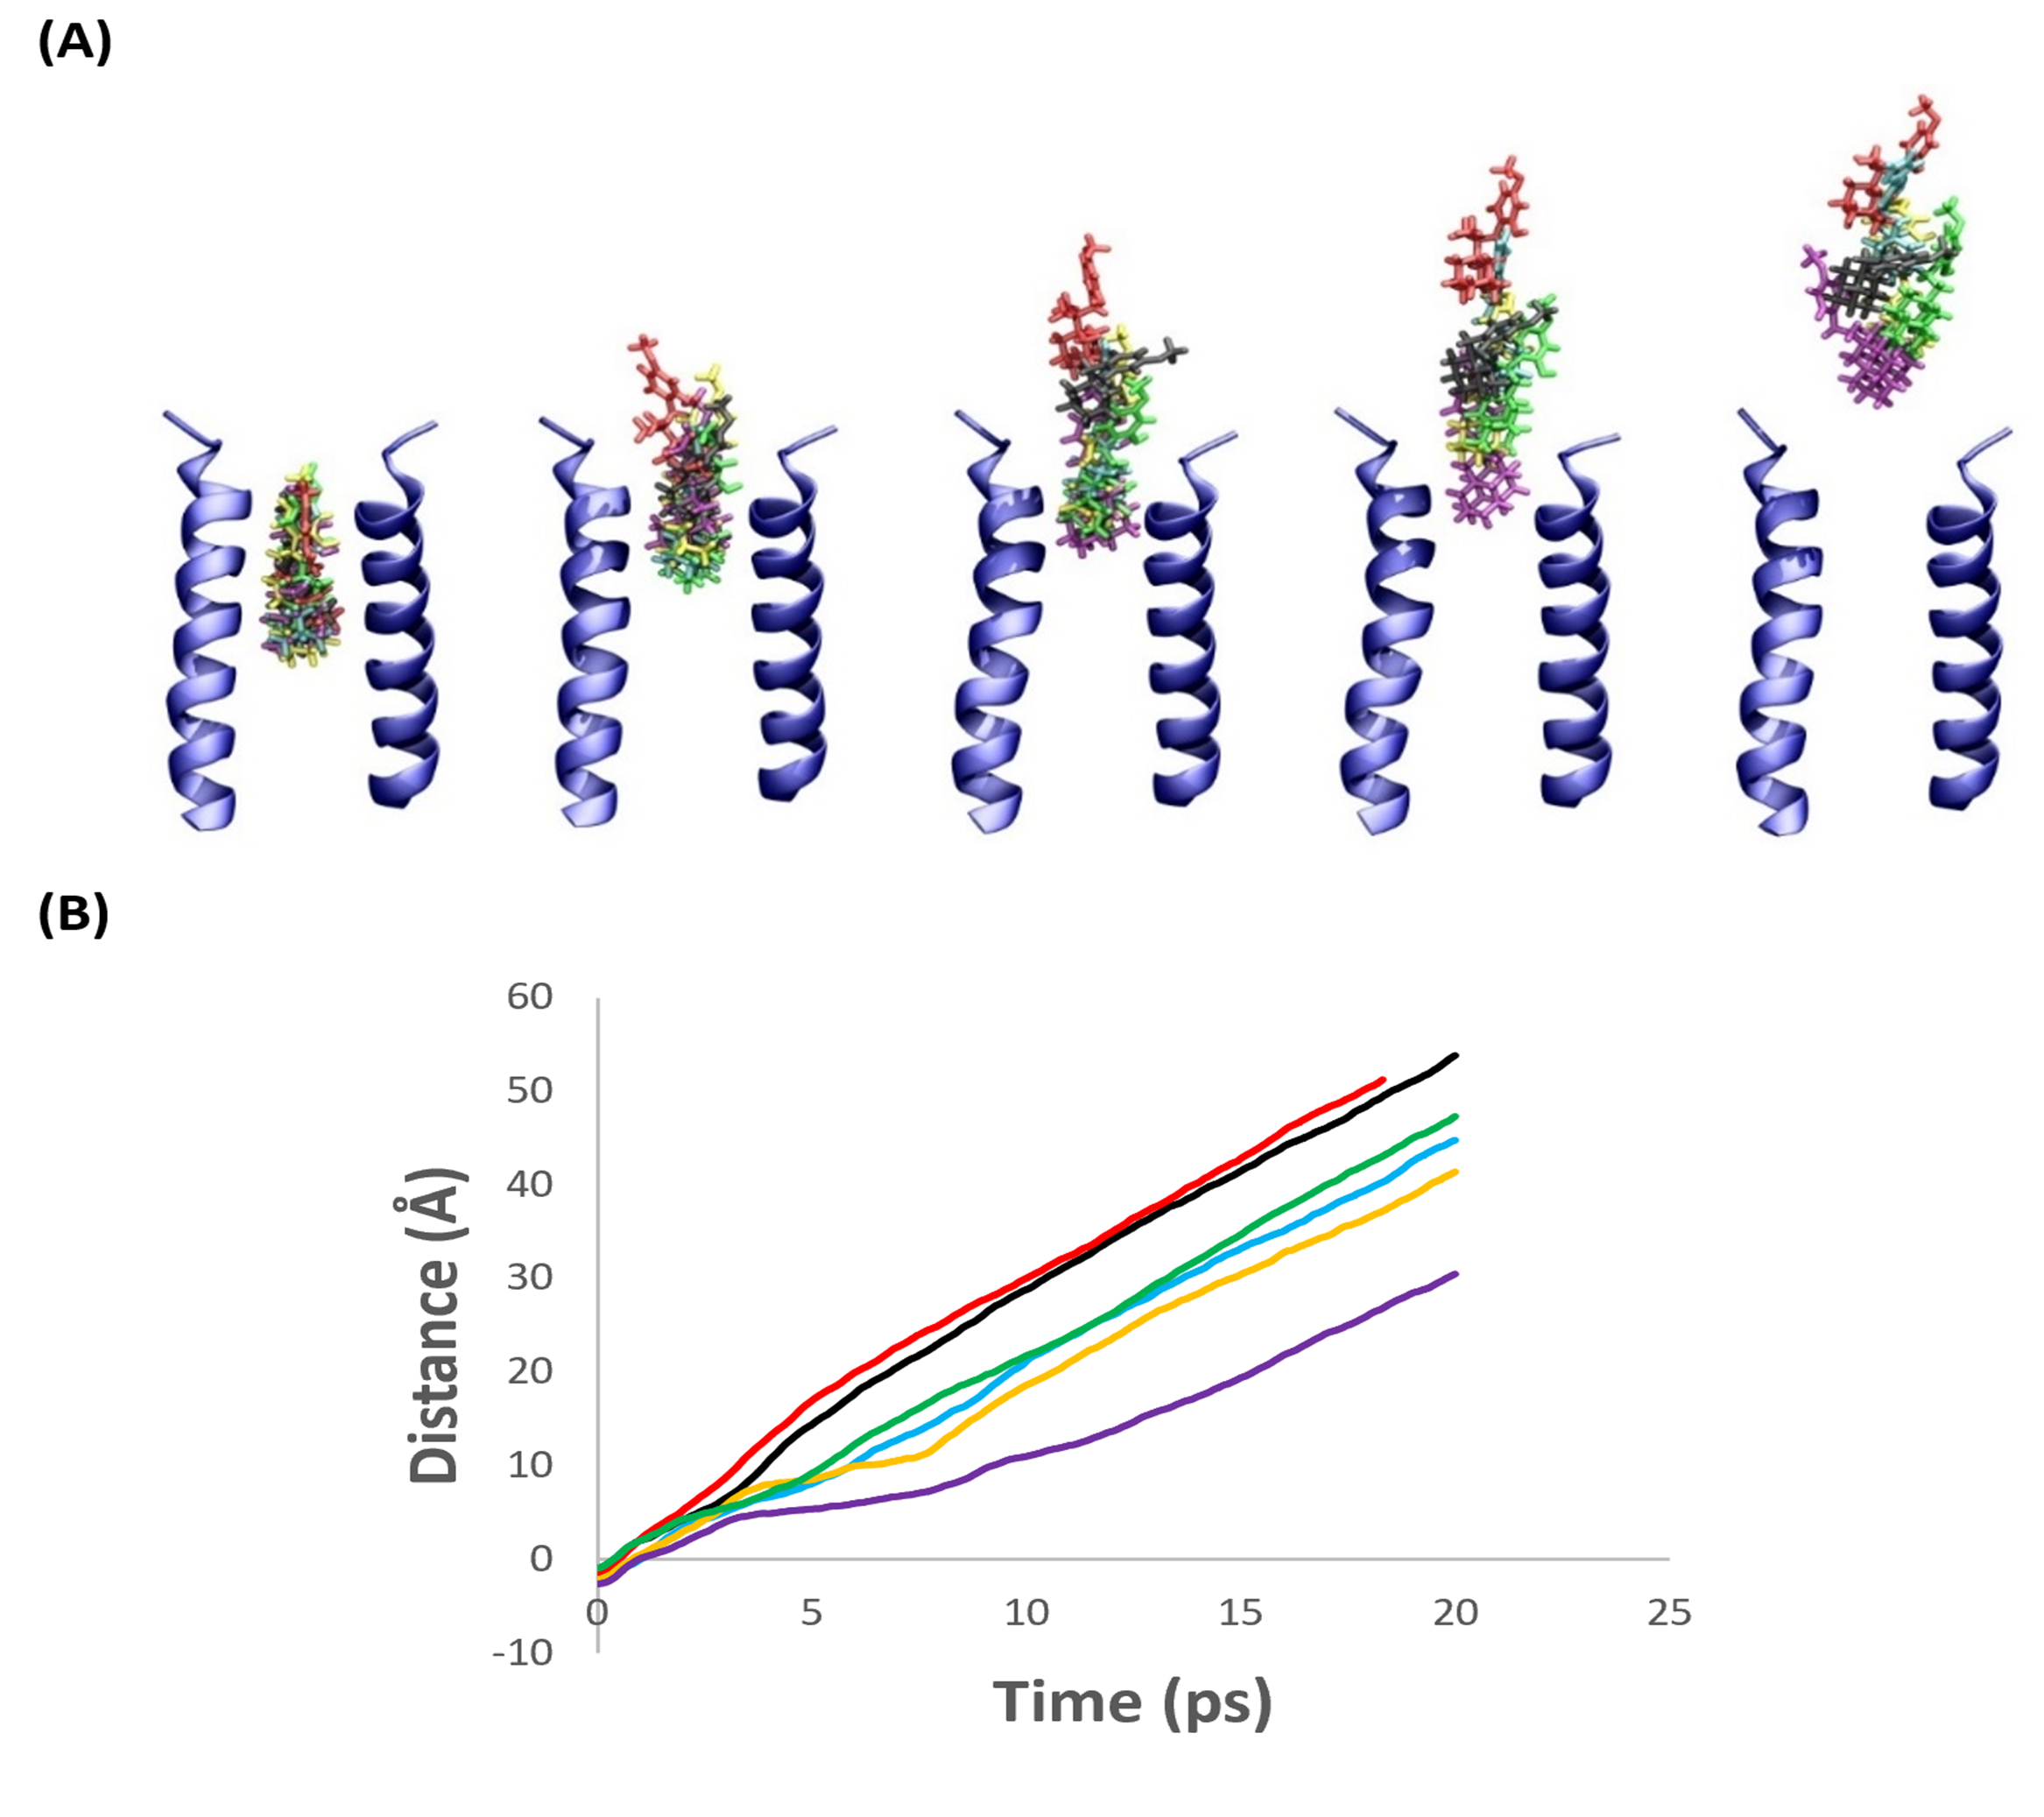
Steered-MD simulations showed that compound 2 dissociated from the protein faster than the other compounds suggesting that it would have a low residence time in the M2 channel (Figure 11). This correlates with the TEVC data where compound 2 did not show any measurable block of inward current. Compound 1 showed similar results to compound 2 with SMD constant force and constant velocity simulations. Compounds 3, 4 and 6 dissociate in roughly the same amount of time in constant-force SMD and with a similar force in constant velocity SMD simulations. TEVC results show similar percent washouts (in five minutes) for compounds 4 and 6. Compound 5 was slowest to dissociate from the protein in constant force SMD simulations and required the largest force in constant velocity SMD simulations. TEVC shows compound 5 has the lowest percent 5-minute washout. However, its kon is significantly lower than the other compounds. This shows the important interplay between kon and koff. Though compound 5 shows the lowest dissociation, its low kon ultimately makes it less effective as an M2 blocker. In contrast, compound 6 has a greater percent washout, but a significantly higher kon, and thus is the more effective M2 blocker.
Figure 11. (A) Snapshots taken at 0, 2, 5, 10, and 15 ps, left to right respectively, from constant-force SMD trajectories using 2KQT mutated (S31N) in hydrated DMPC bilayer. The front and back monomers, water, and lipids have been removed for clarity. 1 (Black), 2 (Red), 3 (Yellow), 4 (Green), 5 (Purple), and 7 (Cyan). (B) The average of five independent trajectories for each ligand center of mass (COM) with constant force SMD relative to N31 COM position. V27 COM = 5 Å, D24 COM = 10 Å, and S22 COM = 13 Å. Same color code as 3A.
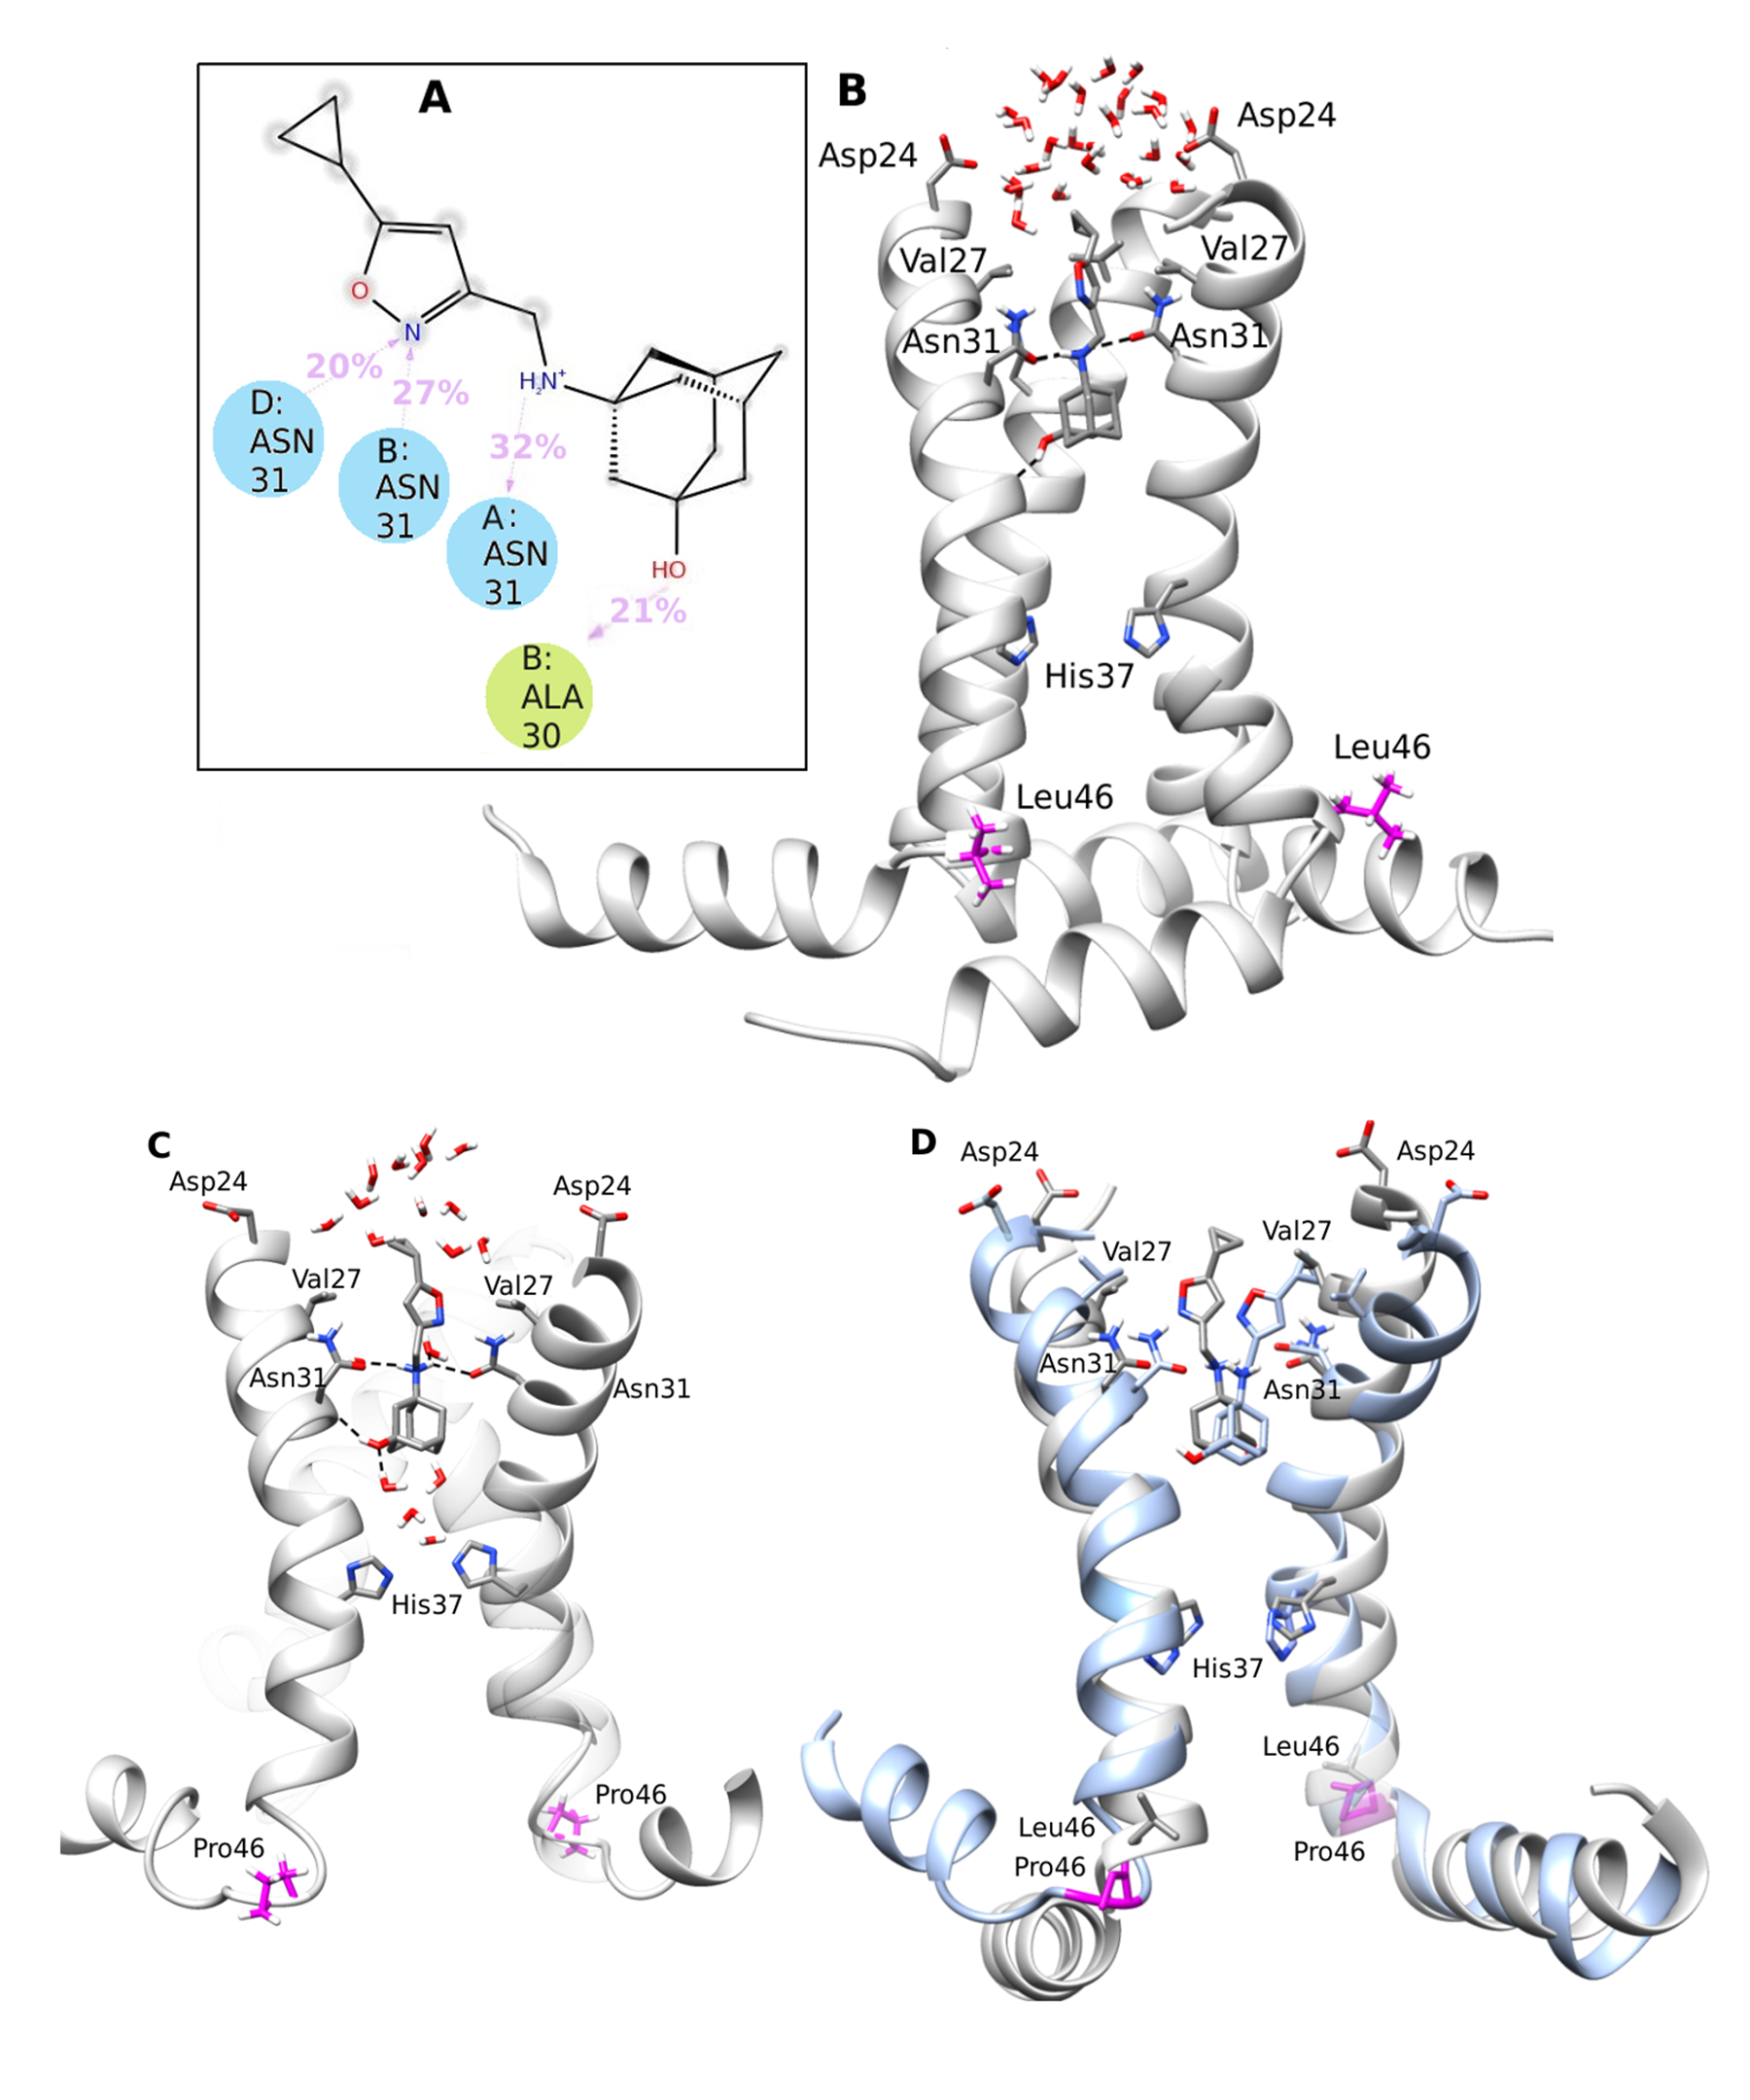
♦ Investigation of the effects of mutation to M2AH S31N by the novel class of the conjugate molecules including Amt and polar heads using electrophysiology, MD simulations and binding free energy MM-PBSA calculations of the full M2 protein (Figure 12) (in collaboration with Dr Jun Wang, Arizona).
Figure 12. Influenza A M2 S31N channel and virus is inhibited by the HO-Amt - polar-head conjugate by the interaction described in panel (A) and (B). The virus became resistant through the mutation L46P outside the channel which was observed for the first time. (C) P46 γ-turn effected a conformational change in AHs that produced a broadening of the N-end and a loose of compound 4 binding interaction shown in (A) and proton channel blocking. (D) It is showed a superposition of the complexes between compound 4 and M2AH S31N and between compound 4 and M2AH S31N L46P.
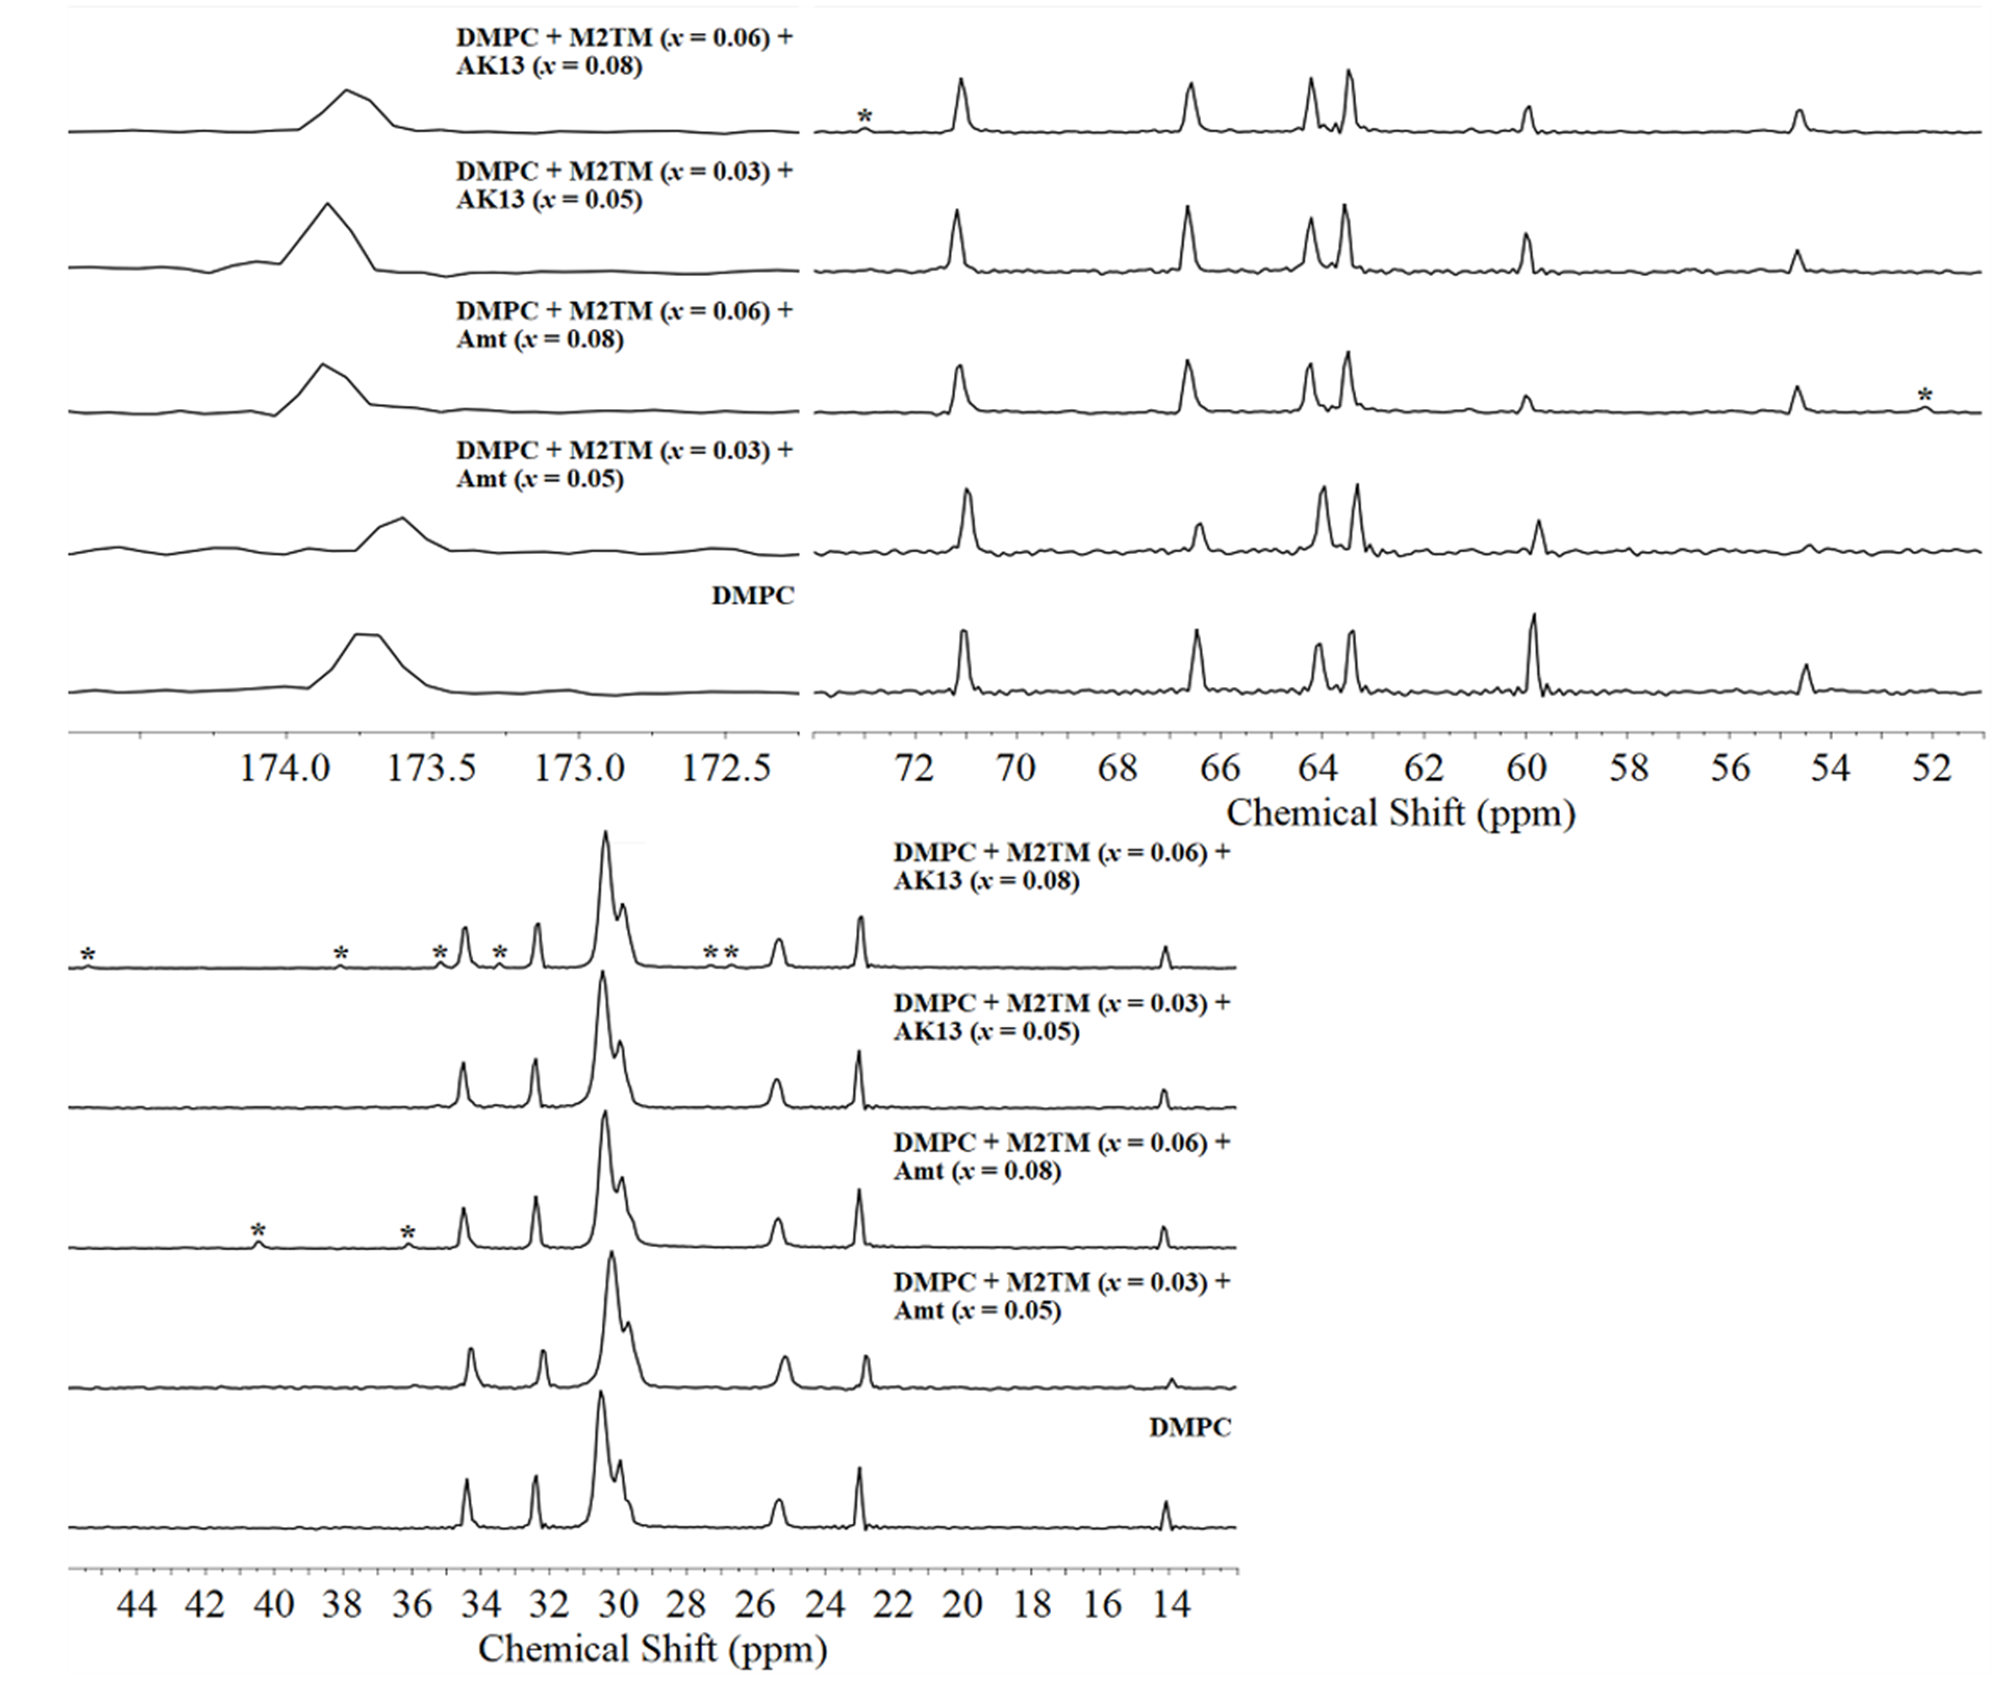
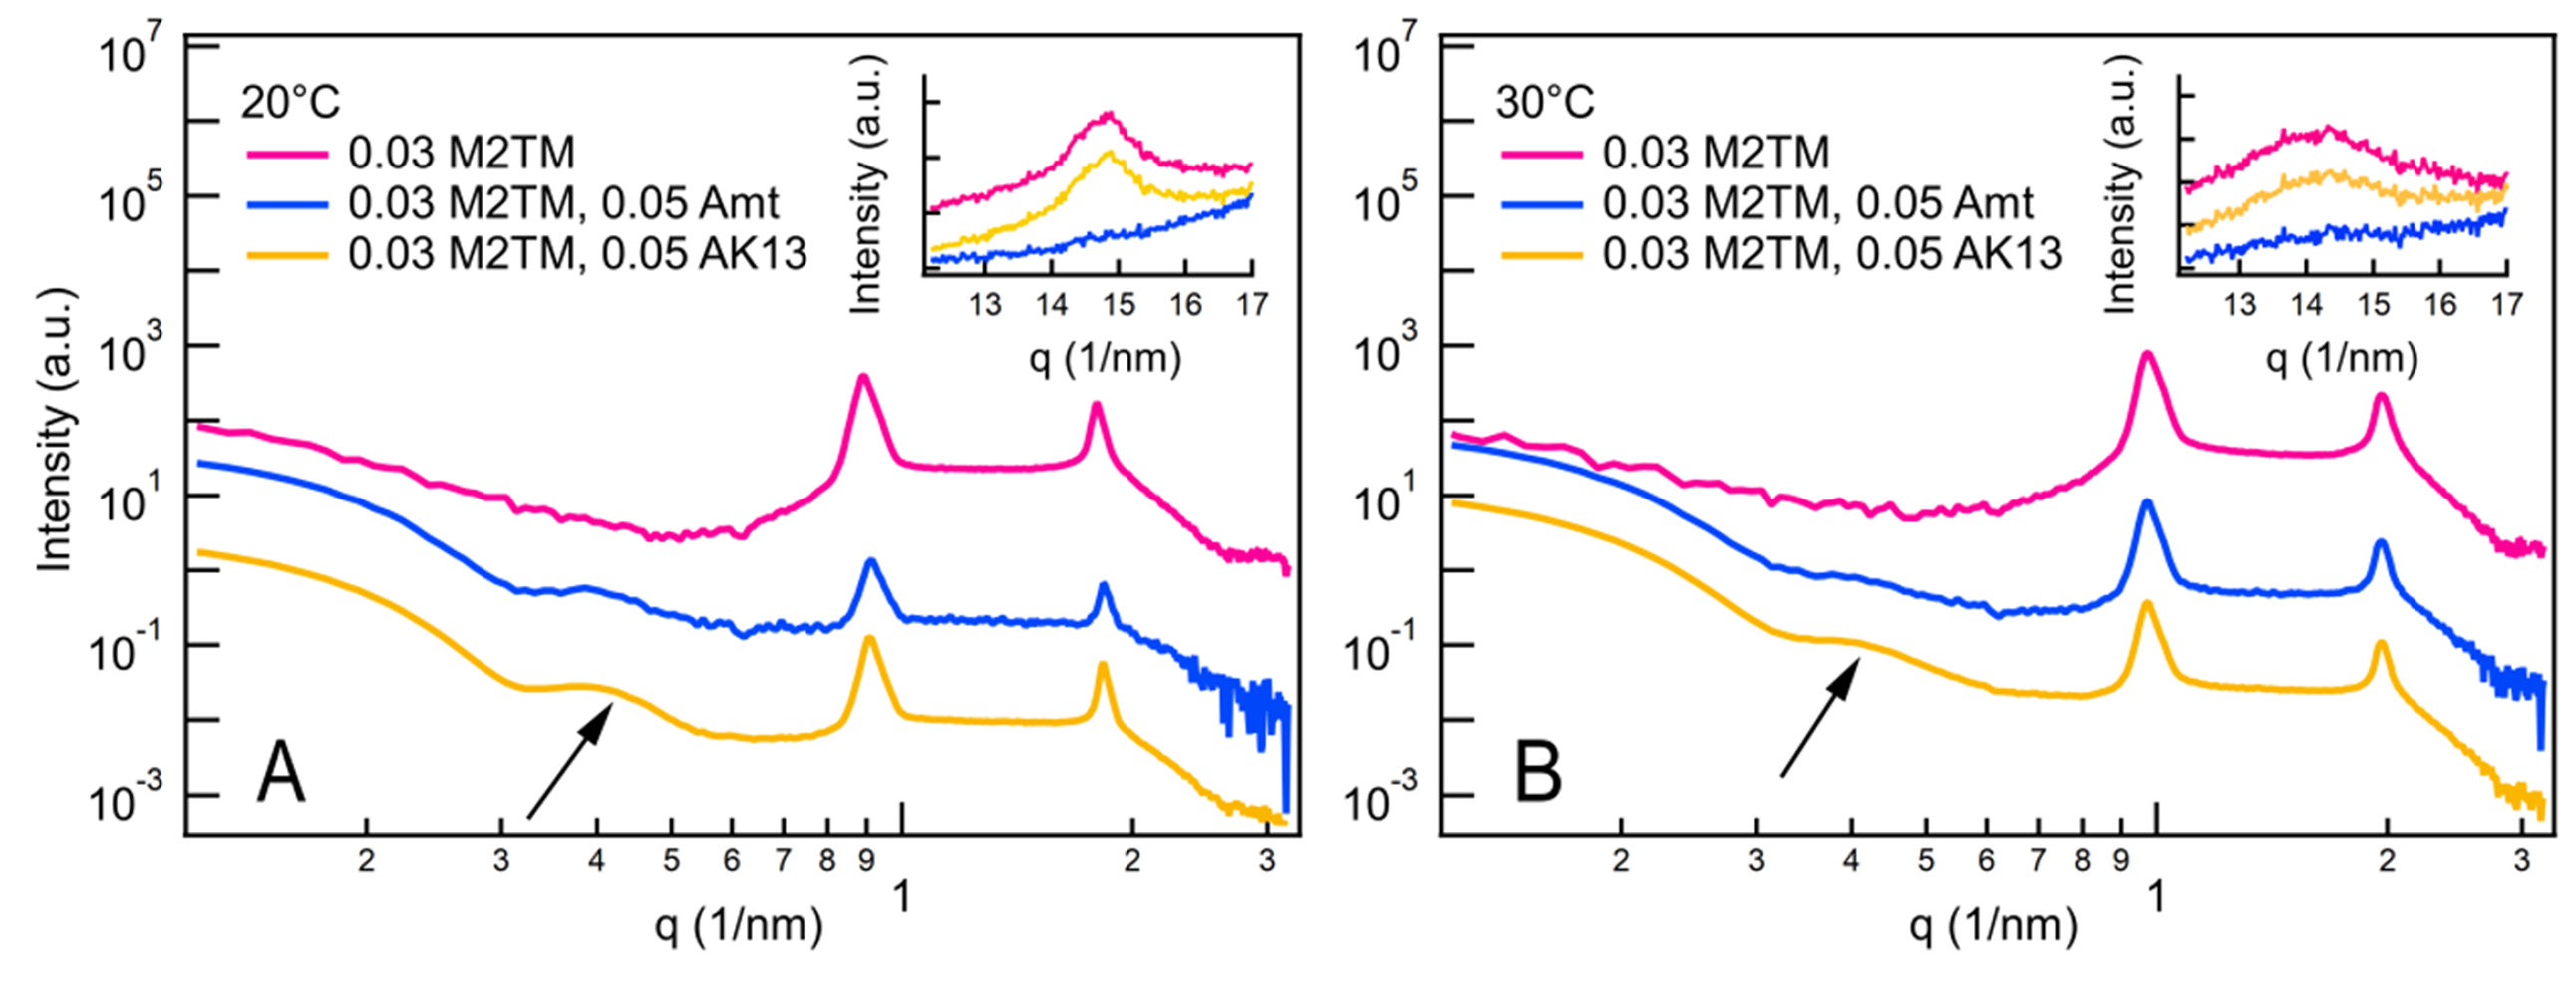
♦ The study of M2 or M2TM apo-protein and their-ligands complexes using: (a) 1D ss NMR spectroscopy of samples in DMPC bilayers (in collaboration with T. Mavromoustakos, G. Mali, Slovenia) (Figure 13); (a) SAXS and WAXS experiments (in collaboration with T. Mavromoustakos, B. Sartori and M. Amenitsch, Trieste, Italy) (Figure 14).
Figure 13. 13C CP-MAS NMR spectra of DMPC bilayers with M2TM (upper traces) and with M2TM and Amt or AK13 (bottom traces) at 35 ºC and pH 8.0.
Figure 14. X-ray scattering curves of DMPC + M2TM (x=0.03) in the absence or presence of Amt or AK13 at concentration x=0.05 at 20 °C (A) and 30 °C (B) and at pH 8.0. Insets show the WAXS peak arising from the lipids chain packing. Traces were vertically shifted for clarity. The broad shoulder was indicated with an arrow.
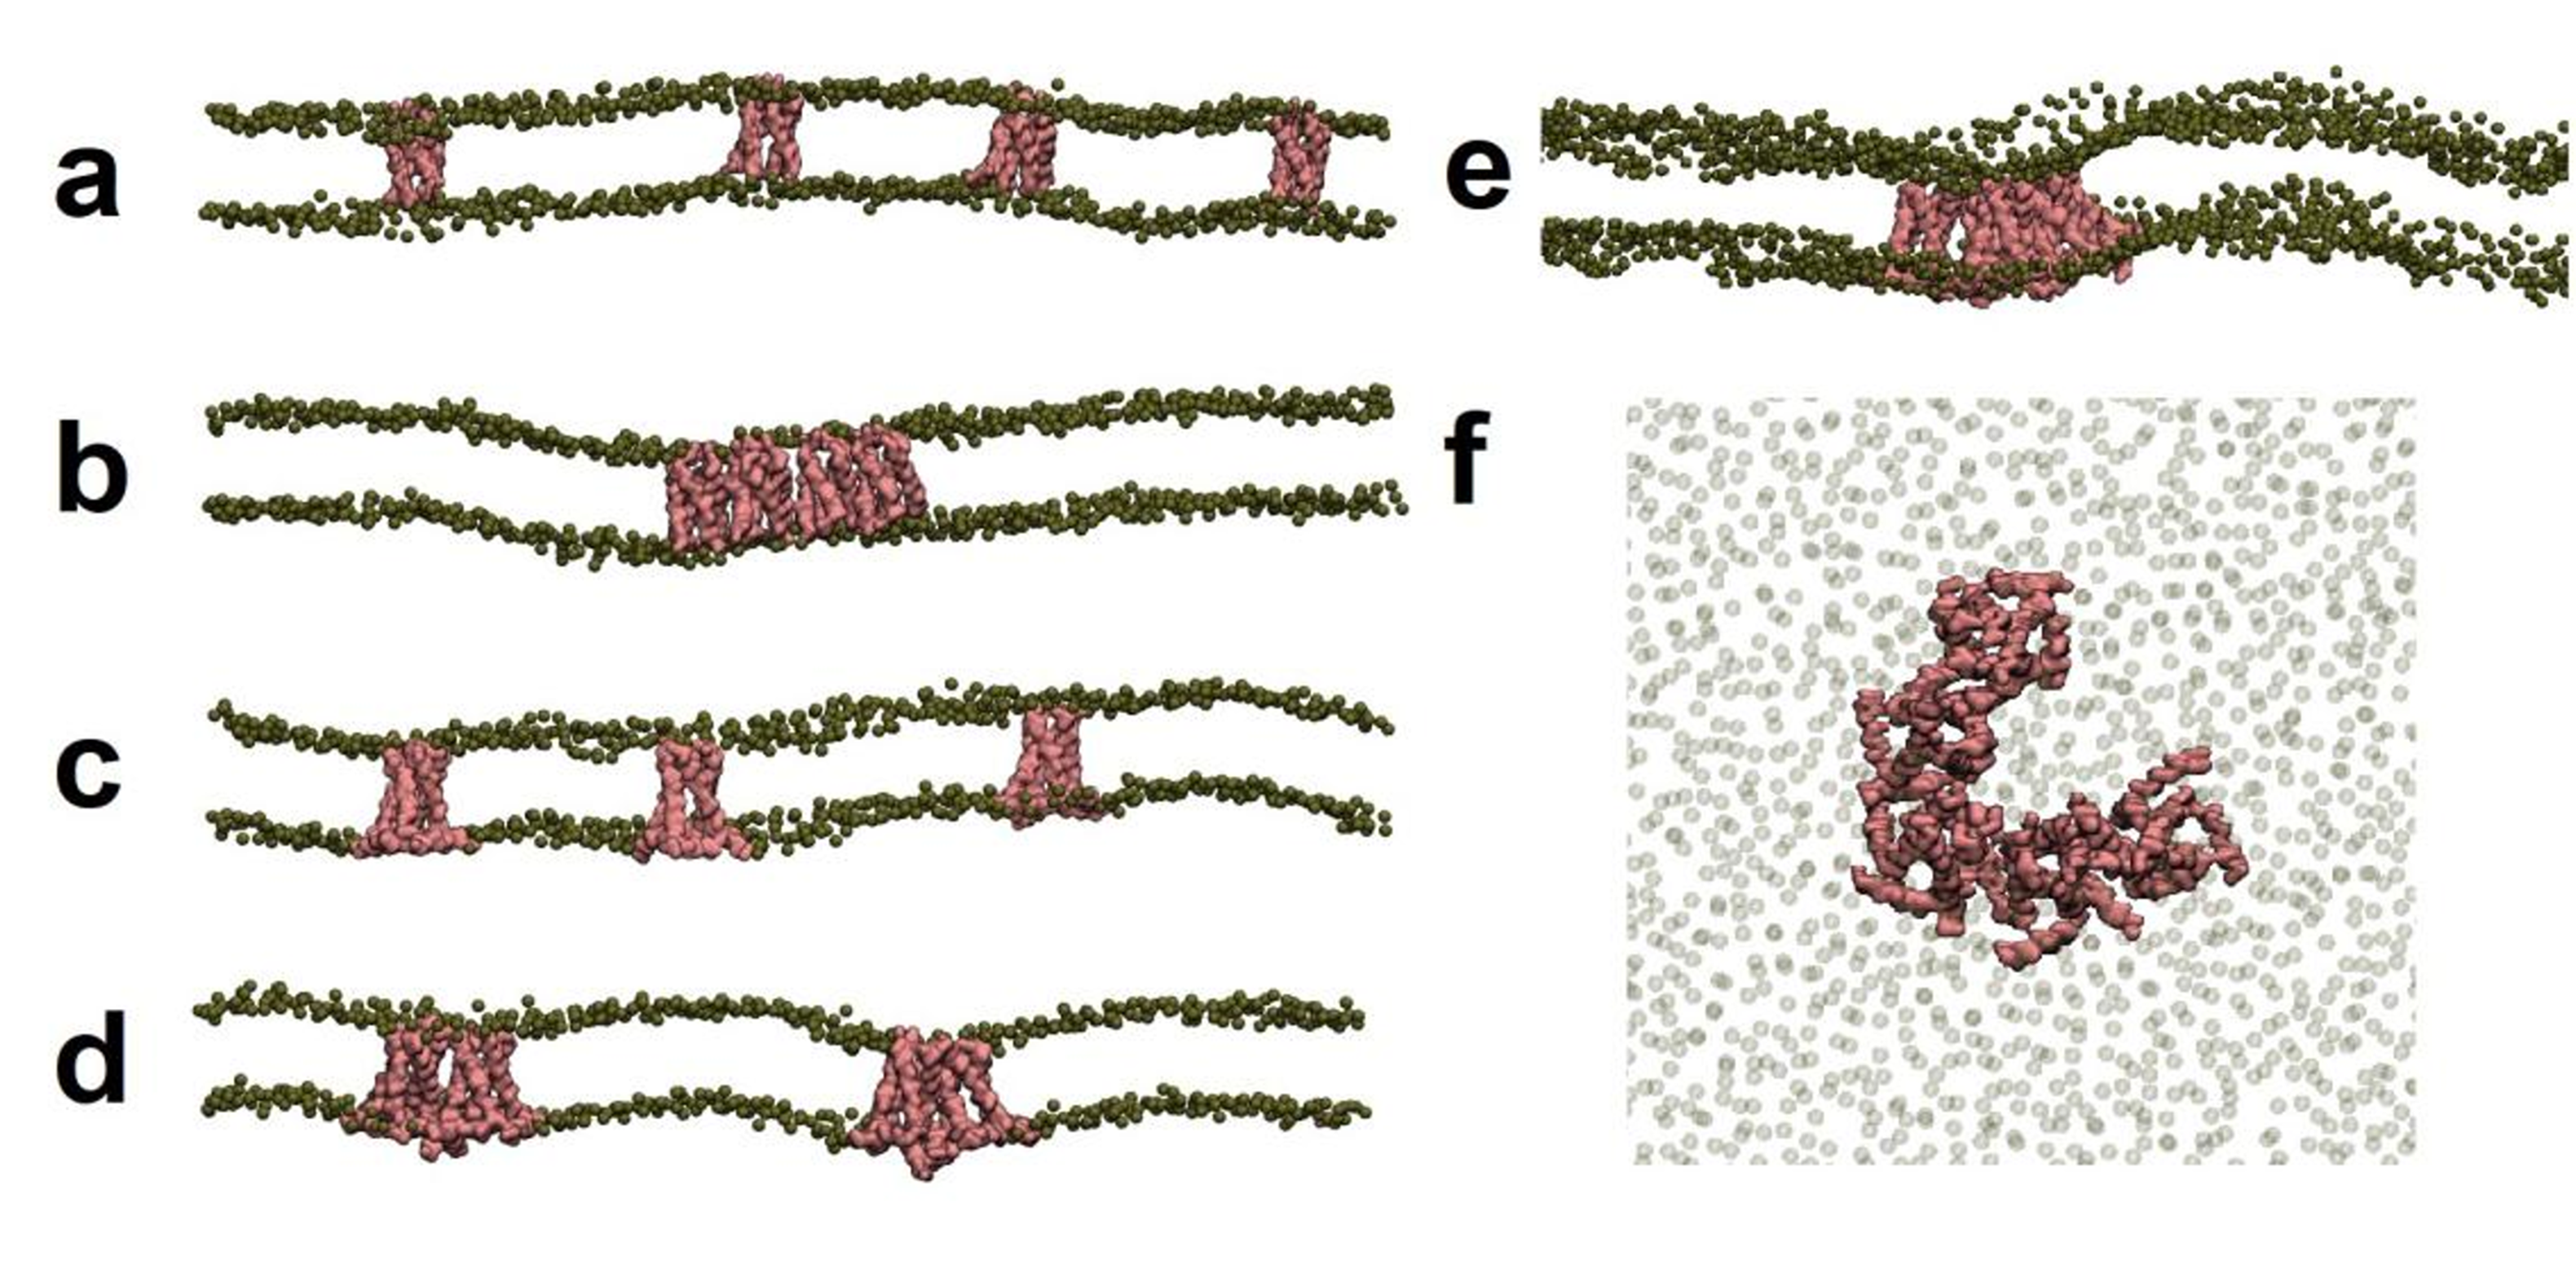
♦ Protein dynamics in crowded environments is important for understanding protein functions in vivo and is especially relevant for membrane proteins because of the roles of protein-protein interactions in membrane protein functions and their regulation. Coarse grained (CG) MD simulations were performed for 10 μs in systems including 16 tetrameric M2TM or M2AH in 4800 lipids of DMPC, POPC without of with cholesterol (Chol) and POPC/POPS without of with Chol. The POPC/POPS/Chol 20% resemble the cell membrane structure. Increased clustering is observed in M2AH compared to M2Tm and in POPC/Chol compared to POPC. Additionally, the CG MD simulations of the longer M2 construct known as the conductance domain suggest clustering-induced membrane curvature formation. Such clustering appears to have direct biological relevance during budding of the nascent influenza virus. We demonstrate for the first time that Chol increases protein-protein interactions, clustering and membrane curvature (Figures 15, 16) (with Prof. M. Sansom, Biochemistry, Oxford).
Figure 15.(a)-(f): First and last snapshot from 10 μs CG MD simulations of different M2 systems including. M2’s backbone is shown in pink while the phosphate head group beads are shown in green. Only a patch of membrane is presented with the indicative locations of protomers or clusters. (a) M2TM DMPC first snapshot. (b) M2TM DMPC last snapshot. (c) M2AH DMPC first snapshot (d) M2AH DMPC last snapshot. (e) M2AH POPC/Chol 30% last snapshot (f) Top view of the M2AH pentamer shown in Figure 1e.
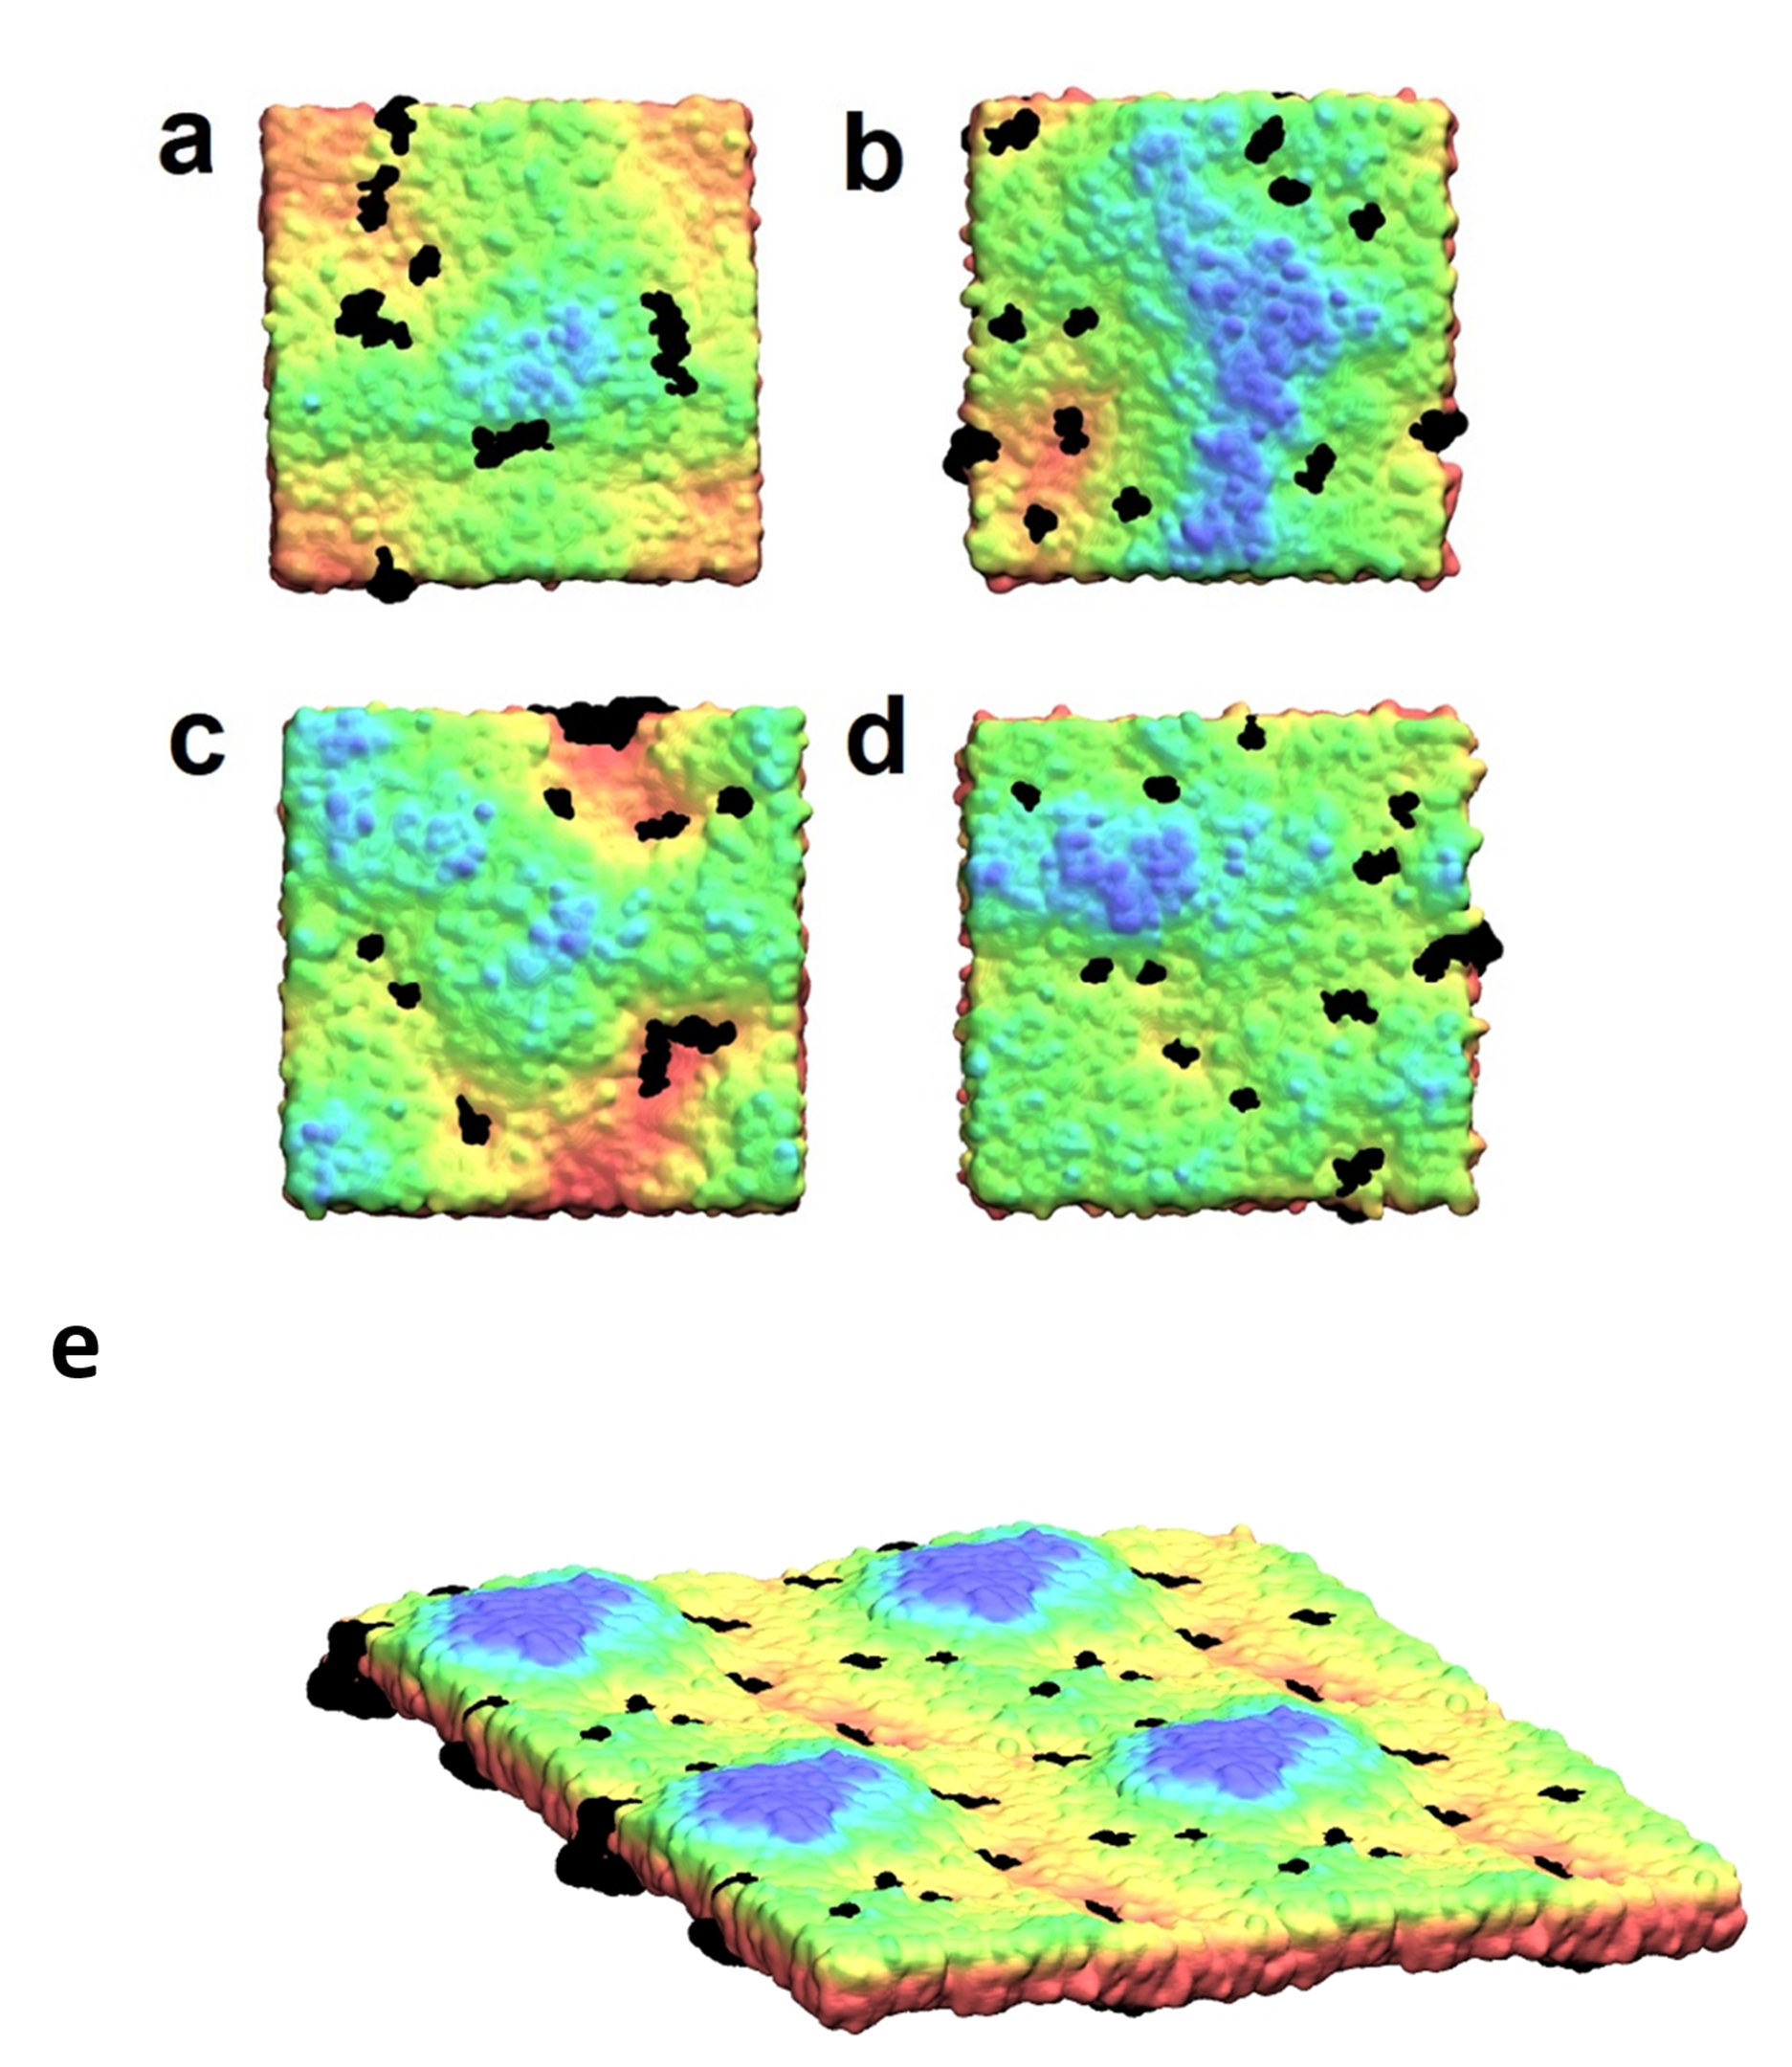
Figure 16. (a)-(e): Final snapshots from the production runs showing a top-view of membranes plane. Lipids are colored according to their position on z axis (from red lipids -|z| to blue lipids +|z|) and proteins are colored black. (a) M2TM in DMPC; (b) M2AH in DMPC, (c) M2AH in POPC/Chol, (d) M2AH in POPC/POPS. M2AH clusters are seen in valleys of the membrane colored as red-yellow areas and never at peaks (blue areas) while M2TM clusters are spread across membrane regardless the membrane curvature. (e) Final snapshot from the production run showing a plane-side view of the M2AH POPC/POPS/Chol system simulation box multiplied by 4. M2AH clusters which induce membrane curvature are observed in black in the neck areas or valleys (red-yellow lipids). Blue colored lipids in membrane peaks are the parts of the newly constituted viral membranes ready to be developed into virions.