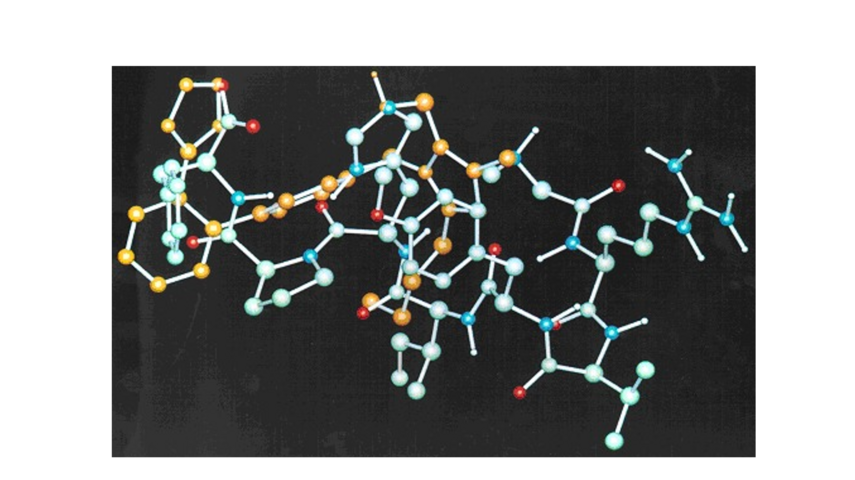
In the case of highly complex and very flexible molecules the combination of NOESY experiments and MD or Monte Carlo simulations of the trajectory can give valuable information for their average conformational preferences. Former projects included the conformational analysis of drug derivatives and bioactive peptides (Figure 1). Additionally since some of these molecules were lipophilic drugs, their effects in membranes were investigated using biophysical methods like DSC and ssNMR (with Prof. T. Mavromoustakos).

Figure 1. Superimposition of a low energy conformer of a bioactive peptide with its non-peptide drug antagonist; the peptide conformer structure was derived from a NOE constrained molecular dynamics simulation.
In collaboration with natural product chemists we were involved in the structure elucidation, and relative stereochemistry verification of natural products using various 2D NMR spectroscopy techniques, COSY, HMQC, HMBC, NOESY (with Prof T. Mavromoustakos and Prof C. Demetzos).
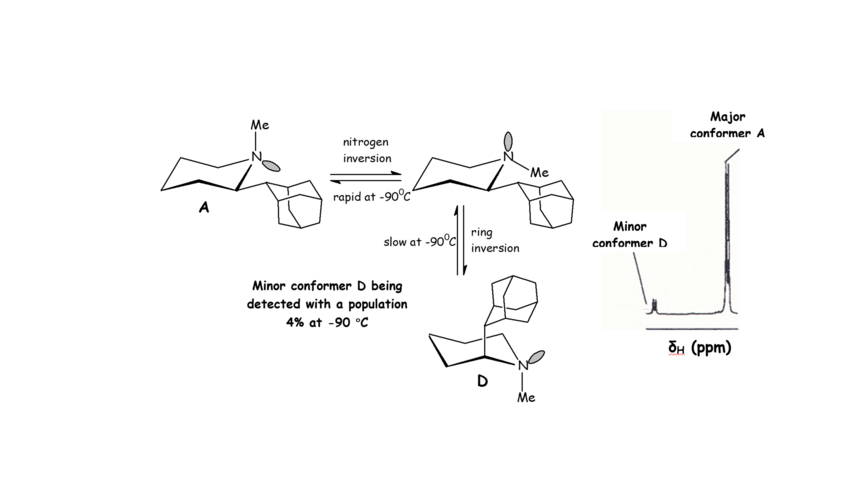
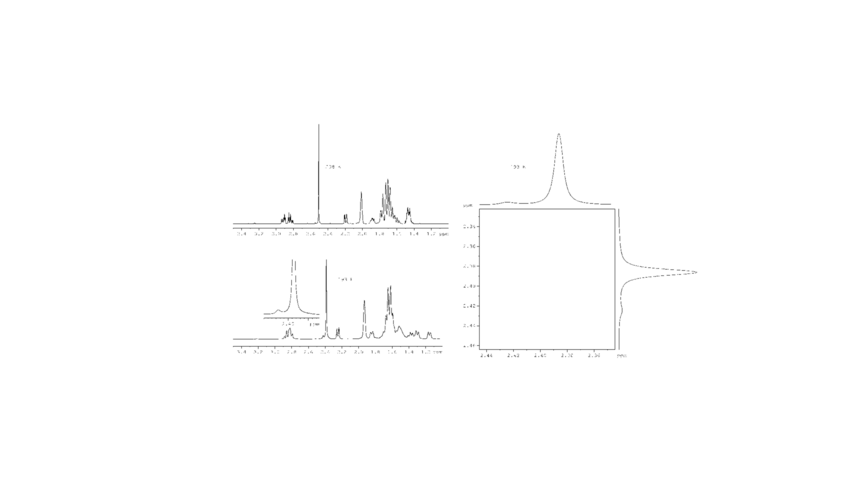
This includes the solution conformational analysis of synthetic organic molecules with restricted internal motion, ring inversion, nitrogen inversion and bond rotation, using Dynamic NMR spectroscopy. The distinct NMR signals of the populated conformers, which can be observed usually only at low temperatures (Scheme 1), can be identified using a combination of 2D NMR experiments, COSY, HMQC, HMBC, NOESY, EXSY (Figures 1,2), and computational chemistry, molecular mechanics or ab initio calculations. Using such a detailed experimental analysis, minor conformers can be identified increasing the knowledge of conformational properties.
We have analyzed the Dynamic NMR spectra of aminoadamantane derivatives (with Professor, E. J. Anderson, Chemistry, UCL and Professor A. Mazzanti, Organic Chemistry, Bologne).

Scheme 1. Populated conformers A, D of the 2-(2-adamantyl)-N-methylpiperidine being identified at -90 0C when ring inversion became a slow process. NMR spectra of 2-(2-adamanty)-1-methylpiperidine 2 in CHCl2F/CHClF2/CD2Cl2 ~45:45:10 solution (500 MHz) at 183 K when a N-Me signal of a minor isomer (4.0%) was identified.

Figure 1. Part of the 1H 2D EXSY spectrum at 193 K showing the exchange peak between the two N-Me signals of major A and minor B conformation.

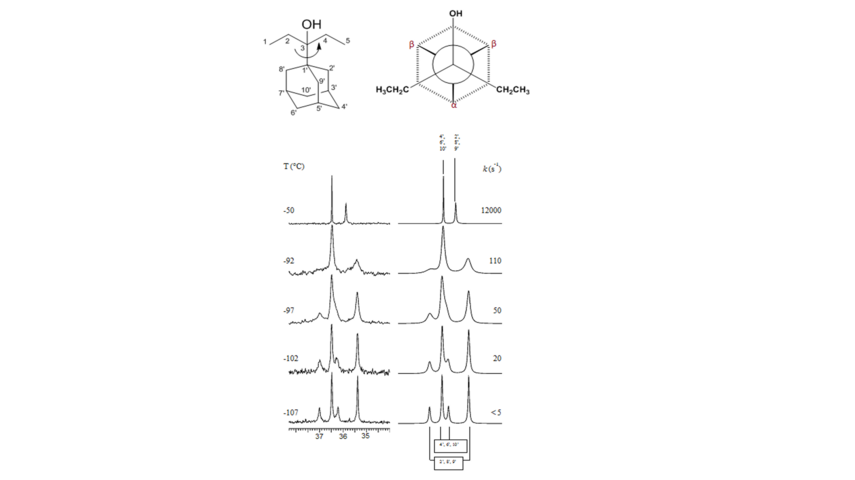
Figure 2. VT spectra for Ad-CEt2OH (13C NMR 150 MHz in CDFCl2). On the left is shown the evolution of the CH2 signals on lowering the temperature. On the right are reported the line-shape simulations with the corresponding rate constants. The bond rotation studied is shown in the upper scheme of the figure